Hello,
I'm trying to use three variables at a time in a scatterplot. I chose two variables for the x and y-axis. And the third one is the size of the symbol proportional to the attribute.
Can anyone please tell me how to make a legend for the plot showing the details of axis and the size of the symbol? I'll attach the figures for reference. Thank you.
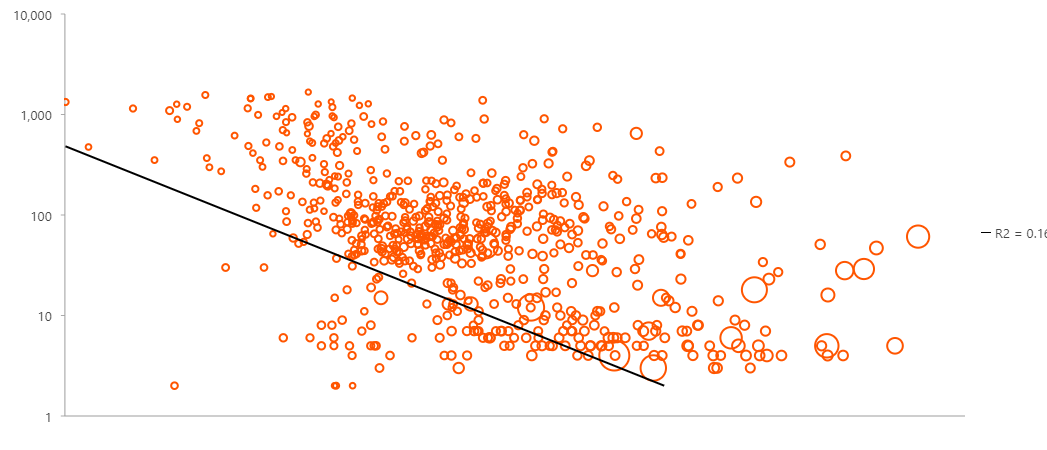
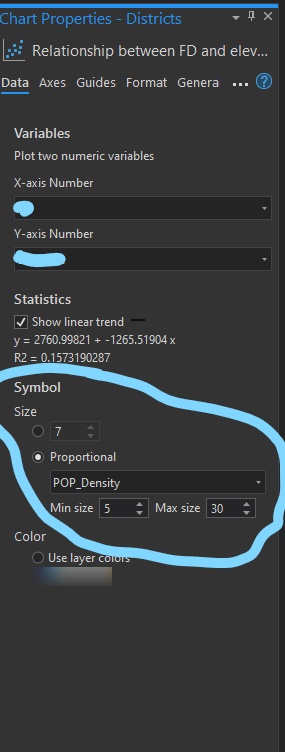
I want to show the radius of symbol ranges in the legend. Please help.




