Hi,
In my example, I am trying to display a field in a bar chart and I want to see the values for that field alone. When I add a field called [Issue], the subtype field called [SubTypeCD] also gets brought into the chart, as per the image below:
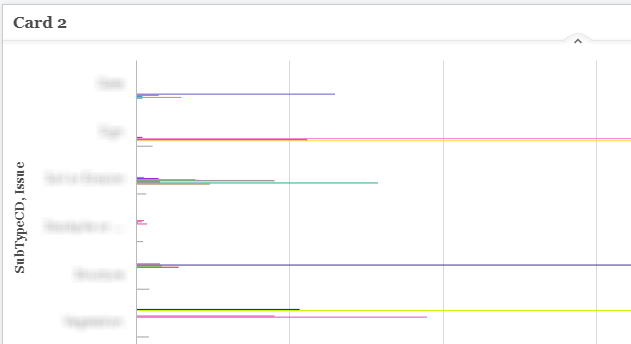
I should only have the types of issues I have show up.
This also becomes a problem if I want to setup a Predefined Filter, when I select one of the fields it separates the values. In the example below, the [Status] field has only 2 possible values, "Open" or "Rectified". The subtype also gets brought in and then separates the values out for each subtype. Even when I try to add all these options, the "Apply" button is greyed out until I have one of the options deselected.
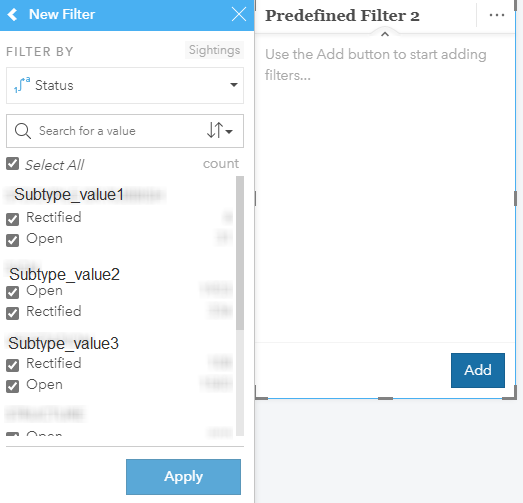
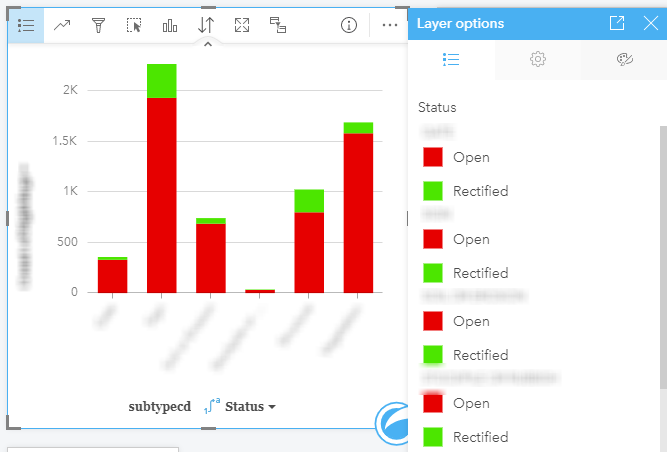
Lastly, when showing the legend of a chart, due to the issue above, repeated values show up for each subtype that looks a little silly for the end user as per below.
Anybody have any solutions to this? Hopefully I am missing something really easy.