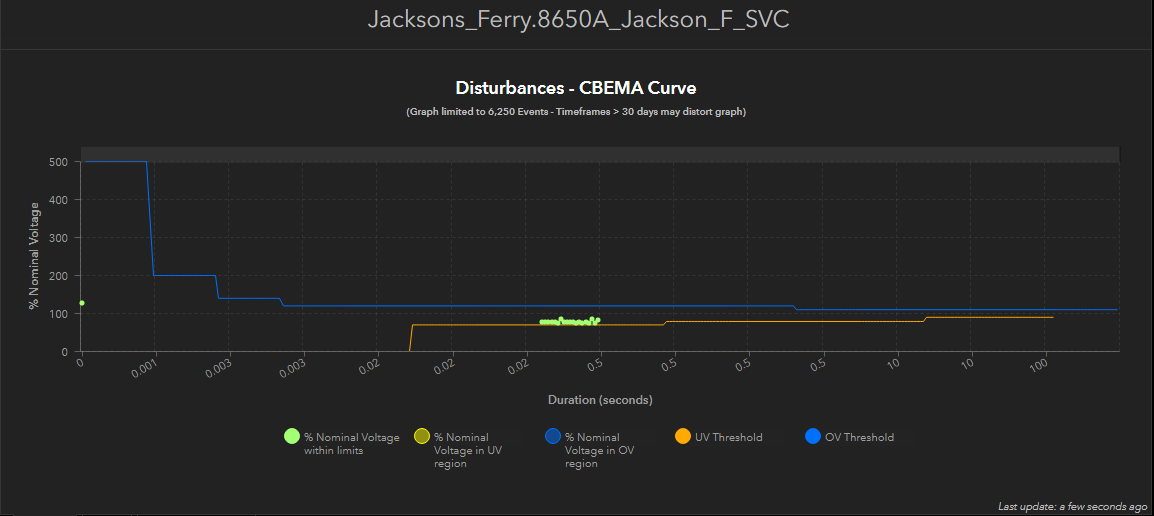
I'm trying to build a serial chart that contains dynamic point data and also includes line data to show thresholds for values. These thresholds vary as we continue down the x-axis, so a straight guideline won't work. The chart needs to filter the points by various attribute values, but the lines need to be consistent across all selections. Here is an example of the formatting.