The Esri Defense and Intell Showcase gave an outstanding demo of the Find Meeting Locations tool used with other Pattern of Life tools.
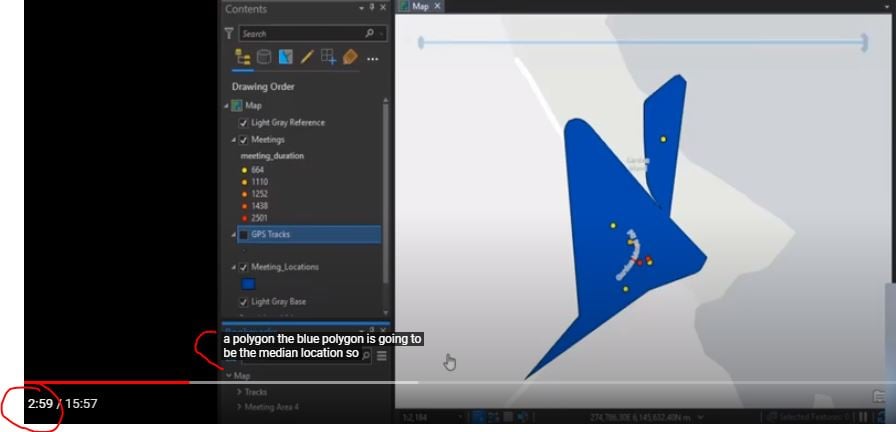
I'd like to understand the analytics and presentation. Like, why does the meeting locations output polygon layer look like this?
The Pro 2.7 tool reference only says:
The tool creates two output feature classes: an area feature class indicating the locations identified as potential meeting sites and a point dataset as the centroid of the unique meeting location.
Not much to go on. There is slightly more info in this clip which I extracted from the Showcase video and posted on YouTube. At 2:57 in the video, the analyst says:
"The blue polygon is going to be the median location, so this is going to be an inclusive area
of where a lot of meetings are occurring as determined by the tool."
What does this mean? Why was this analytic chosen?
I see almost no ArcGIS references median location .
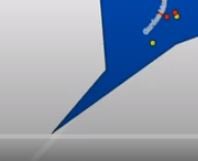
Would it make more visual and logical sense to use one of the density tools that produces a typical ellipse for analysis like this? Otherwise, what is the meaning of pointy end shapes like this? How are we supposed to make use of it?
Thanks.


