Hi @LynneBuie @LaurenGriffin and folks from Esri Spatial Statistics Team,
I am using the Emerging hot Spot Analysis tool to analyze time-series of raster imagery data and have the following questions about the results from this tool:
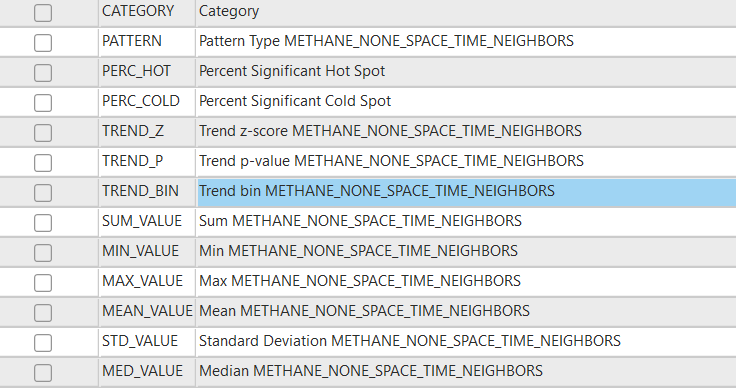
1) There are several variables in the Emerging hot Spot Analysis result (Output Features) as shown in the screenshot below. However, neither the tool documentation nor online resources give specific explanations for them. I am particularly confused about the variable TREND_BIN (trend bin). Is it the same one as the EMERGING_{ANALYSIS_VARIABLE}_TREND_BIN variable or the {ANALYSIS_VARIABLE}_TREND_BIN variable that are added back to the Input Space Time Cube as described in this page: https://pro.arcgis.com/en/pro-app/latest/tool-reference/space-time-pattern-mining/emerginghotspots.htm?
I don’t fully understand what this variable EMERGING_{ANALYSIS_VARIABLE}_TREND_BIN measures. Based on the documentation, “The result category used to classify each location as having a statistically significant upward or downward trend for hot/cold spot z-scores.” Are the z-scores from the Getis-Ord Gi* statistic? For statistically significant positive Gi* statistic z-scores, the larger the z-score is, the more intense the clustering of high values (hot spot). For statistically significant negative z-scores, the smaller the z-score is, the more intense the clustering of low values (cold spot). So, what does the upward or downward trend for those z-scores imply? How does it help to understand the trends in spatial clustering in the data?
2) I would like to visualize the variable EMERGING_{ANALYSIS_VARIABLE}_HS_BIN, which is added back to the Input Space Time Cube. I tried to use Visualize Space time Cube in 2D, but none of the Display Theme offers displaying this variable. I also tired to use Add Multidimensional Layer to load the Space time cube and select this variable in the Select Variables table as described in this page (https://pro.arcgis.com/en/pro-app/2.6/help/data/imagery/working-with-a-multidimensional-raster-layer.htm) however, it didn’t allow me to apply the Unique Values Symbology to this variable.
Does anyone have any ideas or suggestions? Thank you very much!




