Hi all,
I have a slope raster created from a DEM with the raster functions.
I set it up to give it to me in % slope.
The raster initially gives me a range in slope from 0 to 11%.
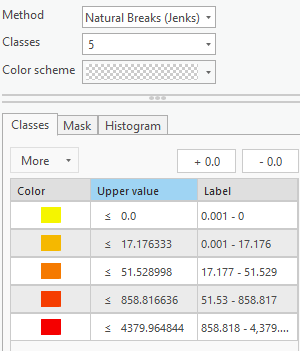
I want to make it so all slope above a given percentage is one color. I figured the best way to do that would be with the "Classify" symbology, which computes a histogram.
After the histogram is created, I now have a range of values from 0 to 4379.
What do these values represent, and how can I view this as the original percentage range again?