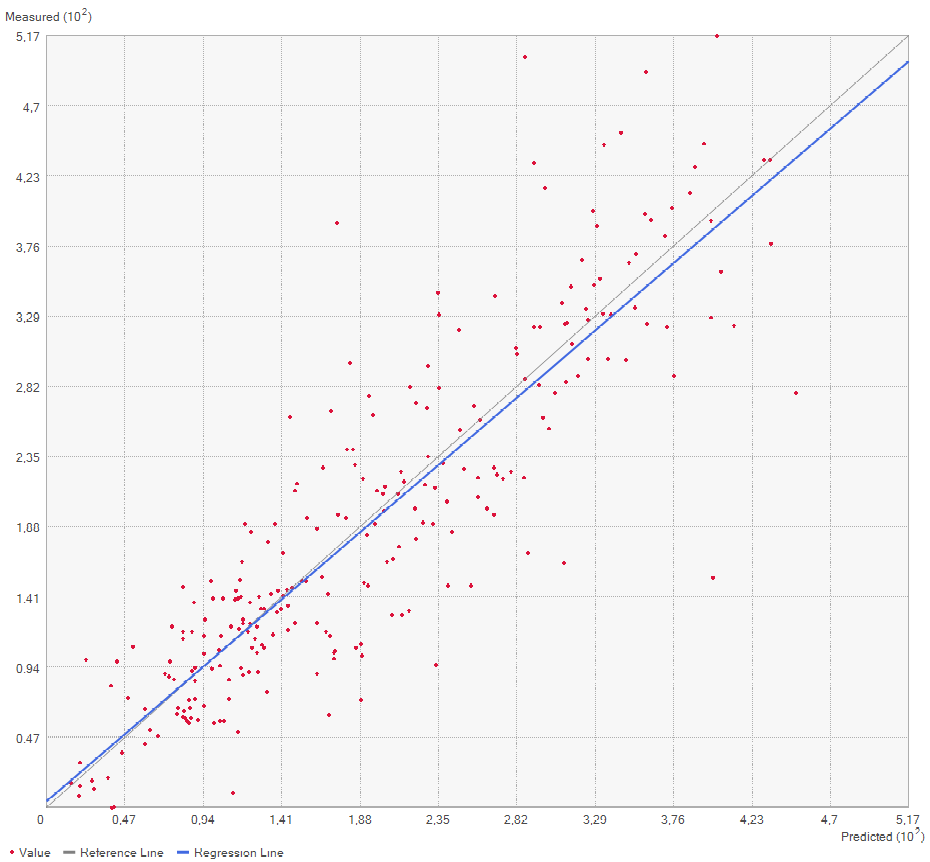
The cross validation plot shows that high measurements (~between 3 and 5) are overestimated (blue line below grey, predicted on x-axis, measured on y-axis):
The standardized error plot indicates underestimation for the same data and value range (~between 3 and 5):
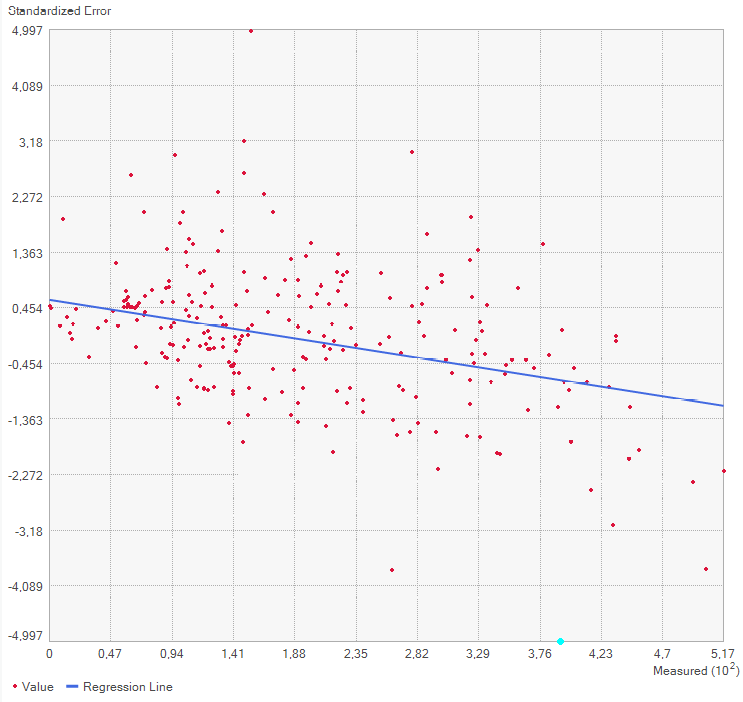
I may misinterpret these plots, but this seems contradictory.
The cross validation was carried out in ArcGIS Pro 2.5.0.
Thanks!
Christian




