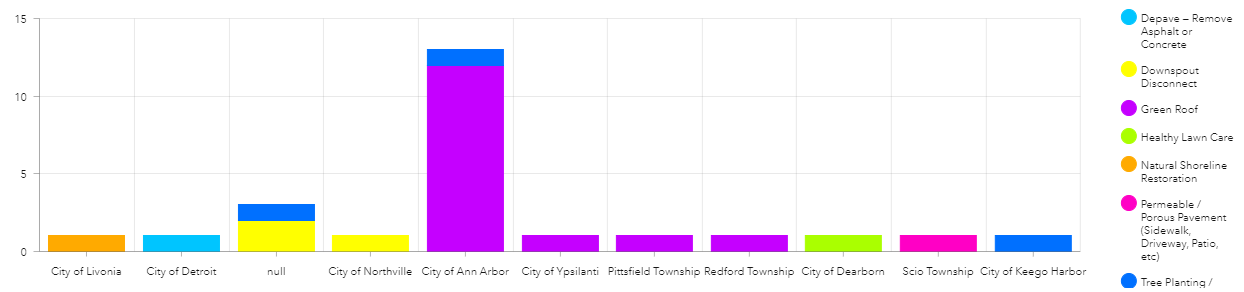
Please allow us to sort by the statistic in the serial chart widget in ArcGIS Dashboards when stacking & splitting by a field.
As of Oct 2022 in the new Dashboards in ArcGIS Online, I cannot sort these columns so that the tallest one is first. In this example, I have category (horizontal axis) = municipality, split by (colors) = project type, and statistic (height of columns) = SUM of field "# of projects". I would like to be able to sort by the statistic so that the municipality with the greatest total # of projects" is first.