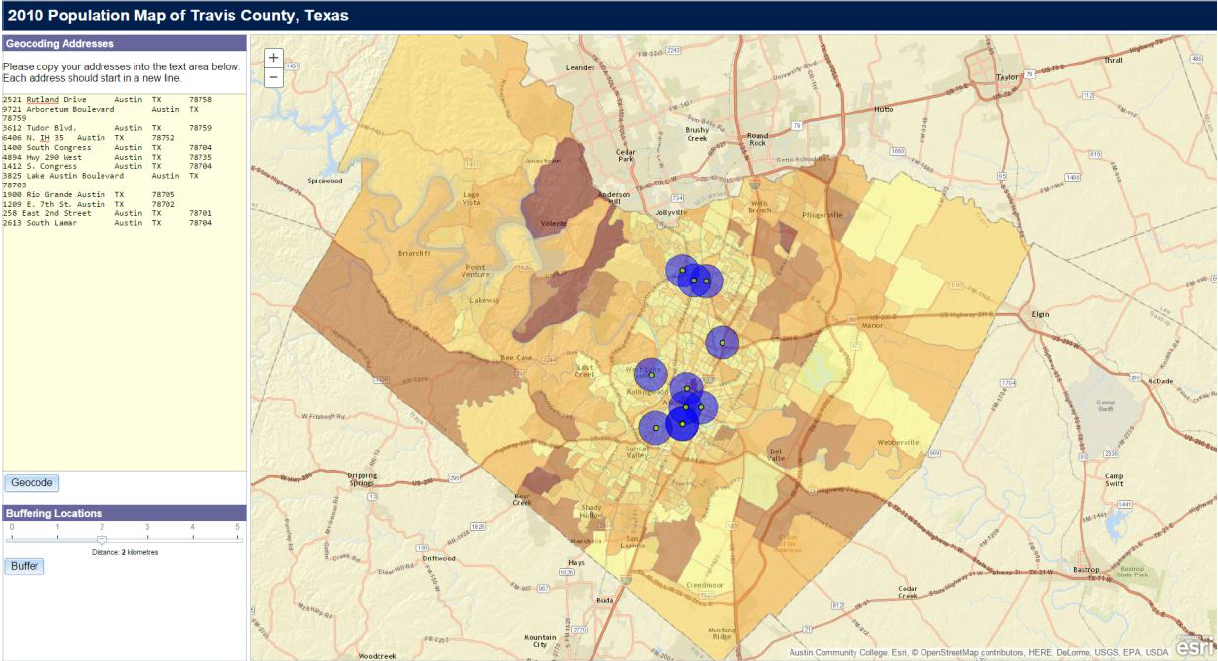
Ok so I have some working code with a geocode service in it already. Again you wont see what i have which is a map of Austin, Texas. I need to have a text area where i can place multiple addresses and then have them geocode ontop of the map when i click a button. I really just need help with this part for now. I will include two files one with the HTML code i need edited and one with HTML to be added to the other or at least somehow implemented. The result should look like this.
any help will be greatly appreciated
I have a n update to my code:
<!DOCTYPE html>
<html>
<head>
<meta http-equiv="Content-Type" content="text/html; charset=utf-8">
<meta name="viewport" content="initial-scale=1, maximum-scale=1, user-scalable=no">
<title></title>
<link rel="stylesheet" href="https://js.arcgis.com/3.16/esri/css/esri.css">
<link rel="stylesheet" href="https://js.arcgis.com/3.16/dijit/themes/claro/claro.css">
<style>
html,body {
height:100%;
width:100%;
}
body {
overflow:hidden;
#title{
font-size: 25px;
font-weight: bold;
color: white;
#map{
padding: 0px;
.item{
width: 100%;
height: 25px;
padding:0;
background-color: #775500;
.itemText{
padding:5px 0 0 5px;
margin:0;
vertical-align: bottom;
font-size: 12;
#legendDiv
{
padding-left: 10px;
.instruction
padding:1;
margin-bottom:5px;
#layerList
padding-left:10px;
padding-top:10px;
<!--#search {
display: block;
position: absolute;
z-index: 3;
top: 25px;
left: 50px;
}-->
.spotlight {
z-index:-1;
position:absolute;
left:50%;
top:50%;
border-radius:50%;
opacity:0;
box-shadow:
inset rgba(0,0,0,0.25) 0px 0px 20px 20px,
rgba(0,0,0,0.50) 0px 0px 0px 1000px;
transition:all 1000ms;
-moz-transition:all 1000ms;
-webkit-transition:all 1000ms;
.spotlight-active {
z-index:2;
opacity:1;
</style>
<script src="https://js.arcgis.com/3.16/"></script>
<script>
var map, layerList;
require([
"esri/map",
"esri/dijit/Geocoder",
"esri/tasks/locator",
"esri/graphic",
"esri/symbols/SimpleMarkerSymbol",
"esri/geometry/screenUtils",
"dojo/dom",
"dojo/dom-construct",
"dojo/query",
"dojo/_base/Color",
"esri/layers/ArcGISDynamicMapServiceLayer",
"esri/dijit/LayerList",
"esri/layers/FeatureLayer",
"esri/InfoTemplate",
"esri/renderers/smartMapping",
"dojo/parser",
"dijit/form/Button",
"dijit/registry",
"dijit/layout/BorderContainer",
"dijit/layout/ContentPane",
"dijit/form/Select",
"dojo/domReady!"],
function(
Map,
Geocoder,
Locator,
Graphic,
SimpleMarkerSymbol,
screenUtils,
dom,
domConstruct,
query,
Color,
ArcGISDynamicMapServiceLayer,
LayerList,
FeatureLayer,
InfoTemplate,
smartMapping,
parser,
Button,
registry
){
parser.parse();
map = new Map("map", {
basemap: "streets",
center: [-97.6982,30.3097],
zoom: 11
});
map.infoWindow.resize(200,125);
var texasLayer = new FeatureLayer("http://localhost:6080/arcgis/rest/services/Austin_Texas/MapServer/0",{mode: FeatureLayer.MODE_SNAPSHOT, outFields:["*"], id:"capital", /*infoTemplate:infoTemplate*/});
texasLayer.setOpacity(.40);
map.addLayers([texasLayer]);
//url = "http://sampleserver1.arcgisonline.com/ArcGIS/rest/services/Locators/ESRI_Geocode_USA/GeocodeServer";
url="http://localhost:6080/arcgis/rest/services/Austin_Streets/GeocodeServer";
locator = new Locator (url);
registry.byId("search2").on("click", doGeocoding)
button.on("click", doGeocoding);
function doGeocoding(){
//Retrive the addresses from the text area
var textArea = dom.byId("search1");
var inputAddresses = textArea.value.replace(//g, "\n").split("\n");
var addresses = [];
for (i=0;i<inputaddresses.length;i++){
var address = {"OBJECTID": i, "Single Line Input": inputaddresses};
addresses.push(address);
var params = {addresses: address};
locator.addressesToLocations(params, showResults);
function showResults(response) {
var candidate;
var symbol = new SimpleMarkerSymbol();
var infoTemplate = new InfoTemplate(
"Location",
"Address: ${city}<br />Score: ${score}"
);
symbol.setStyle(SimpleMarkerSymbol.STYLE_CIRCLE);
symbol.setColor(new Color([153,0,51,0.75]));
var geom; //The geometry of the geocoded point
arrayUtils.every(response, function(candidate) {
console.log(candidate.score);
if (candidate.score > 80){
var attributes = {
city: candidate.city,
score: candidate.score,
locatorName: candidate.attributes.Addr_type
};
geom = candidate.location;
var graphic = new Graphic(geom, symbol,attributes,infoTemplate);
map.graphics.add(graphic);
return false;
else
return true;
//Zoom to the geocoded point
if ( geom !== undefined ) {
map.centerAndZoom(geom, 12);
</script>
</head>
<body class="claro">
<div id="mainWindow" data-dojo-type="dijit/layout/BorderContainer" data-dojo-props="design:'headline', gutters:true" style="width:100%; height:100%; padding:0;">
<div id="header" data-dojo-type="dijit/layout/ContentPane" data-dojo-props="region:'top'" style="height:30px; background-color:#478;">
<div id="title">2010 Population Map of Travis County, Texas</div>
</div>
<div id="leftPane" data-dojo-type="dijit/layout/ContentPane" data-dojo-props="region:'left'" style="width:300px; padding:0; margin:0">
<div class="item"><p class="itemText">Geocoding addresses</p>
<textarea id="search1" rows="25" cols="35"></textarea>
<button id="search2" data-dojo-type="dijit/form/Button">Locate</button>
<div id="map" data-dojo-type="dijit/layout/ContentPane" data-dojo-props="region:'center'"></div>
</body>
</html>
Can anyone help me. I am desperate?
Oh, ok thanks for the update. I knew i had posted in the wrong place
moved to Geoprocessing since Community Help is about getting help on the GeoNet community
another thing your candidate score will need to be >80
Sorry forgot to mention why you wont see the map. Its being done on a virtual machine, with arcgis server and adaptor. if you have either of these you might be able to see things.
Angemeldete Mitglieder können Beiträge verfassen, Updates folgen und mehr. Neu hier? Registriere ein kostenloses Konto.
Find useful guides, FAQs, and documents to help you navigate and make the most of Esri Community.