Hi
I have a feature class with two field I need to plot on a graph in WebAppBuilder. One field is a Date and the other is a Quantity. I want a graph Quantity by Date.
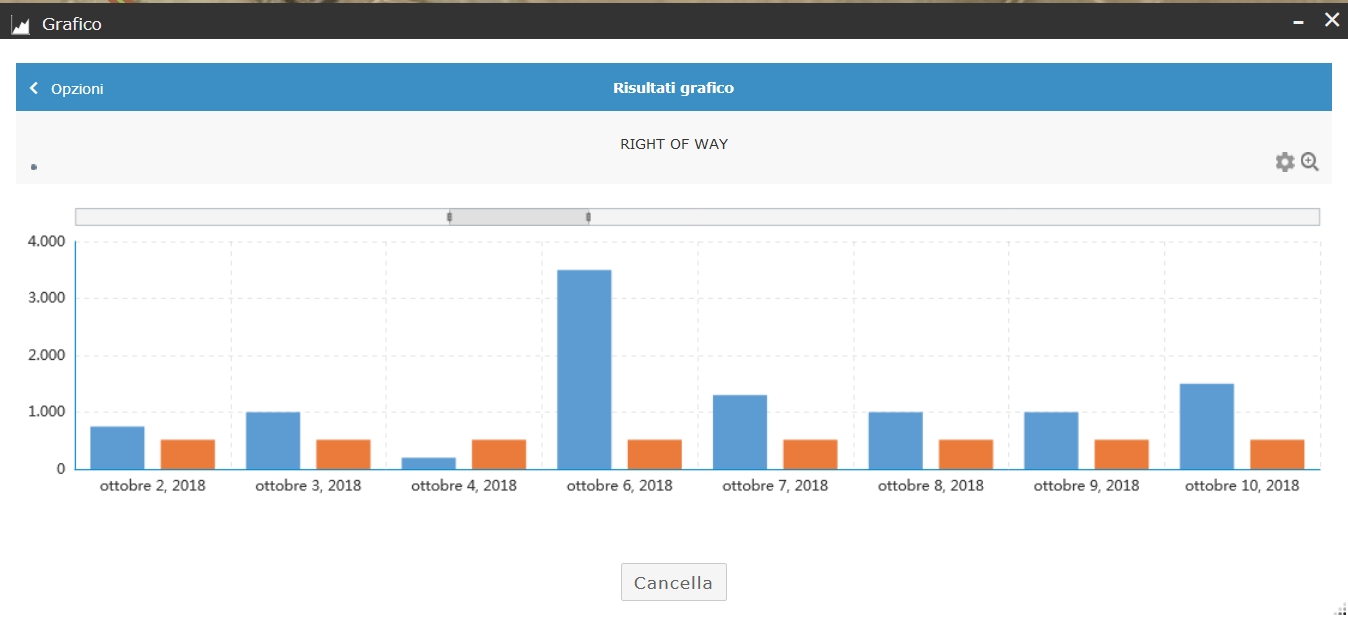
I need a Graph with the Date on a linear X axis and Quantity on Y axis. None of the 4 category of the Graph Widget looks to make the job. The best one is "Display values by category" but as you can see below X axis is not liner ( On 3 October we need to have 0 quantity and not a missing date).
Any way to solve ?
Thanks
Tonino