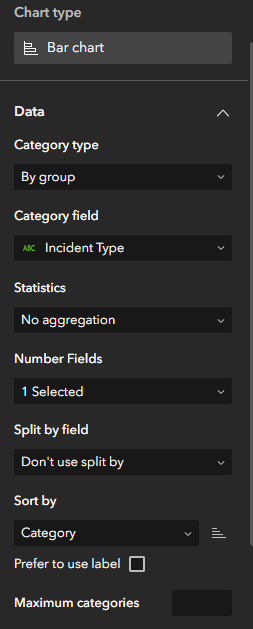
I have a bar chart configured to show a count by category: incident type.
The incident type field is text, with the following domain codes and labels (notice that the labels aren't in alphabetical order, and the codes also aren't sortable as numbers due to being text; this part is out of my hands for the moment):
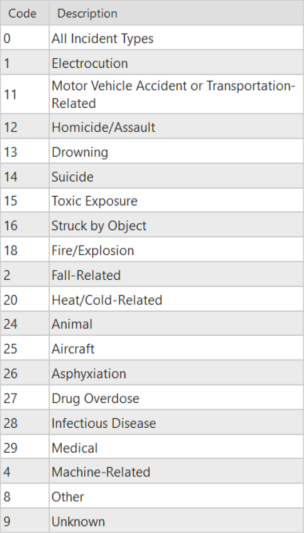
In other products (outside of Experience Builder), the codes are always presented in this order, so I would like to stay consistent with that.
I'm able to do that some way everywhere I'm using them in Experience Builder except for this bar chart, which seems to be treating the codes invariably as numbers?
Here is what the chart looks like, with the first few categories labeled with their underlying domain code. For the sake of consistency with other products, I would prefer that 11 come after 1, 9 be at the bottom of the chart instead of before 11, etc.:
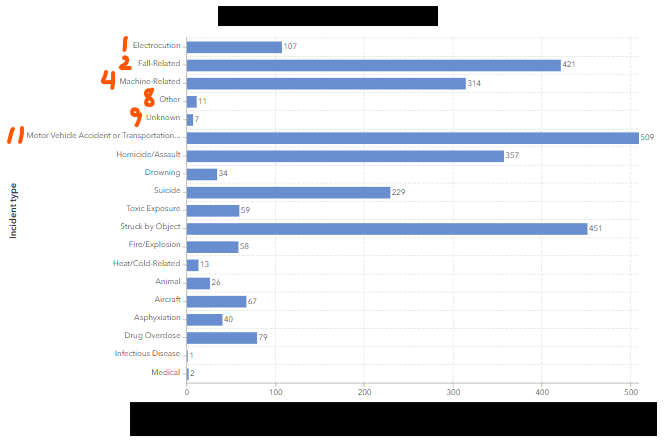
(The data is public, but I'm limiting what I share for the sake of distraction from the issue this post is about)
The chart widget documentation has ("by category" applies to me):
- Sort by—Sort the chart by values or category name, in ascending or descending order.
- Prefer to use label—When you sort by category, you can choose a method for further sorting categories. In By field mode, check the check box to sort by field label (alias) and uncheck the check box to sort by field name. In By category mode, check the check box to sort by attribute label (description) and uncheck the check box to sort by attribute code (coded domain).
I thought maybe unchecking the "prefer to use label" setting would do what I need, but the chart doesn't actually change when I uncheck it. I can't get either an alphabetical sort based on the label OR an alphabetical sort based on the code. What am I misunderstanding about this setting? It clearly wasn't sorting the labels before I unchecked it, so I'm confused about what it's supposed to do, if anyone has used it with success and can provide an example?
This bug sounds a bit like what I'm dealing with, but it was fixed in Feb. 2026.
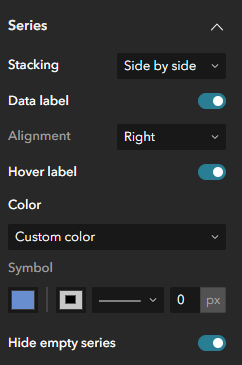
Here is how the data and series are configured:
Weirdly enough, if I change the statistics setting to "sum," I can at least get the labels A-Z, but I'm not able to do that everywhere else (like in a table), so it's not really a solution.