- Can anyone from Esri say if there are plans to allow for more than 10 expressions eventually?
- Is there any other way to achieve what I'm trying to do?
- Finally, a note on the UI.
1. The documentation for advanced formatting in Experience Builder states:
Each app page supports a maximum of 10 Arcade expressions using the widget formatting profile, including both dynamic content and dynamic style set by Arcade script.
2. I'm not actually doing anything terribly fancy--here's my use case:
I'm trying to build an application in Experience Builder that provides much of the same functionality as an existing application (that wasn't built with any Esri products). Essentially, the user can explore various datasets through maps, charts, and tables. Throughout, the filtering experience is such that the values the user chooses are presented in the filters themselves, so the user can remember what they chose out of the sometimes many, many options:
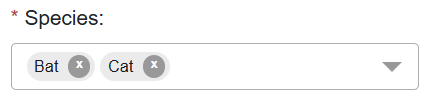
This isn't possible with the filter widget in Experience Builder. Instead, the user sees the number of values they chose from the list:

I have a lot of charts in this experience, and for some of them (because they're so flexible in terms of the filtering options), it might be hard for a user to remember the context of what they're looking at.
For example, here's a chart that displays the sum of tests by year, categorized by county. The user can filter this chart by county, year, species, and/or test result. The first two variables are already covered in the chart itself, but the species and test result values are not. With the new Arcade capabilities in Experience Builder, I can just print out the species and test result values (filtered by the user) that are contributing to the chart:
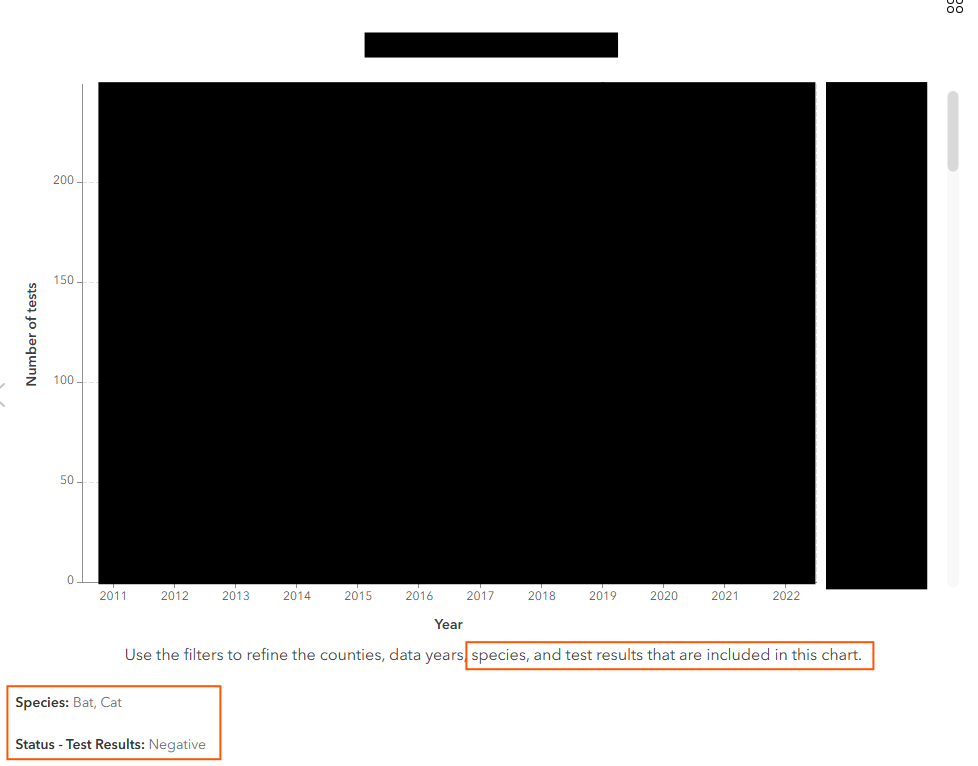
However, I'm finding myself already hitting the limit in terms of number of expressions that use $dataSources per page.
I know there are other things I can do, like:
- Creating a table with the unique values and having my filters filter that table, but this (the Arcade widget formatting) is so much more concise, plus I don't have to maintain some other dataset. I will also eventually be working with some ~200 datasets, so maintaining unique values tables for all of them seems daunting and just a waste of time and resources, even if I scripted it.
- Setting the filters up one by one such that "Bat" and "Cat" are buttons the user can click, so they always see whether that value is contributing to the charts. I'm listing this as an option, but it really isn't. I have dozens of species, so from a UI perspective that just doesn't make sense to do.
This isn't critical. Either we can trust the user to refer back to what they filtered, or we put some kind of reminder, BUT it would make the user experience much better to just be able to see what's contributing to the data you're seeing.
3. Once you add 10 expressions, it becomes impossible to edit your existing expressions without first sending one of them to the pending list.
This is kind of annoying. I could see myself being in the middle of doing this, then getting a message from someone, and totally forgetting to bring the 10th expression back from the pending list.

