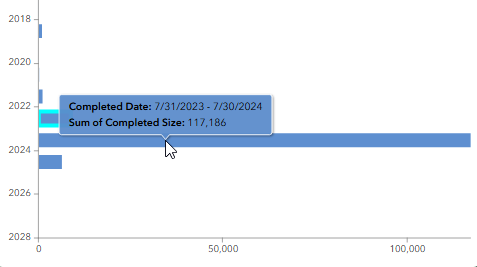
So excited about the new updates to the chart widget in experience builder. I am currently able to reconfigure charts for the new abilities or create new charts that I had to embed from dashboards before. Awesome update!
However, when binning the chart, Parsing the Time category to 1 year and trimming incomplete intervals (not sure if those setting matter), my chart has date ranges that begin in July instead of January. It makes the data look a little strange...
Does anyone know of a way to change the date settings in this new chart display? Could it be the data it is reading? Reading on the Guide, it seems like it is reading and snapping to whenever your first data point is...? So If my first data point is July the entire chart is binned from a July-July basis. This seems problematic, no? We have to report on a year to year basis so that chart outputs are not helpful.... yet!
Any help or discussion, please!