Hi, I'm not sure if i'm missing something here but i can't seem to figure out a way to have my line chart display in month intervals. The first point in my data is 18th Janauary and the rest seem to follow this:
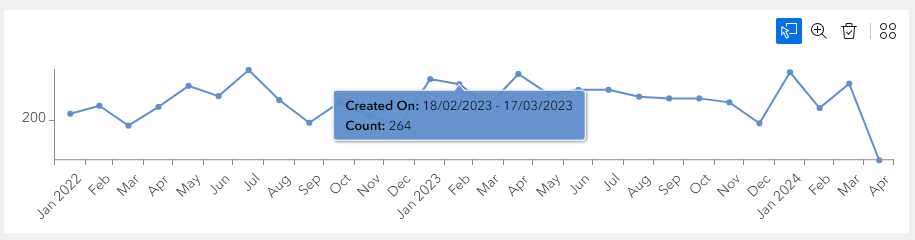
If i try to use a bar chart, the data just does not display:
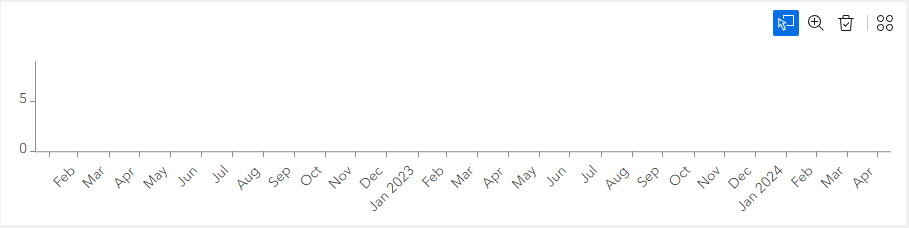
Does anyone have any ideas please?




