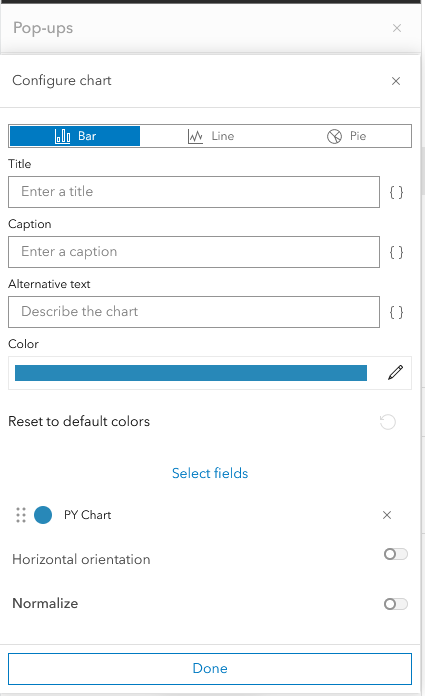
I'm trying to create a chart that displays in a popup, from features in another layer using the current layer as a filter. I have the following code returning the appropriate FeatureSet filtered and grouped as I would like. But the format appears to be incorrect. I can't work out what the correct format is to have the chart actually display the data in the featureset.
var state = $feature.AALRegion;

var portal = Portal('https://www.arcgis.com');

var fields = [
    'OBJECTID',
    'Region',
    'gridcode',
    'Hectares'
];

var fs = FeatureSetByPortalItem(
    portal,
    '7369e87b3b104eae8c18507261184083',     // FeatureService ID that you want to grab fields from.
    0,                                      // Sublayer index, usually 0.
    fields,                                 // Array of fields to grab from the FeatureService.
    False                                   // Include geometry?
);

var final = GroupBy(Filter(fs,"Region = @state"),'gridcode',
      {
        name: 'sumhec',
        expression: 'Hectares',
        statistic: 'SUM'
    },
);

return final