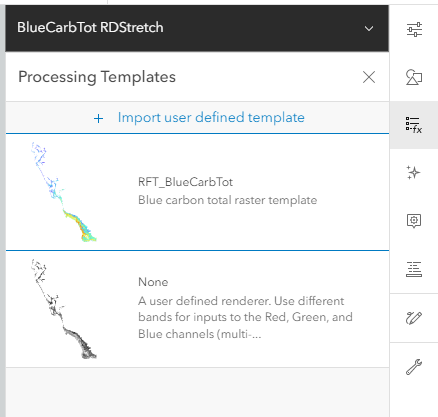
I have published an image service using a raster dataset with a 32 bit floating point pixel depth and a raster function template with stretch symbology. The problem I am having is that when I pull the service into a web map, the symbology appears to change to RGB even though the template is being applied.
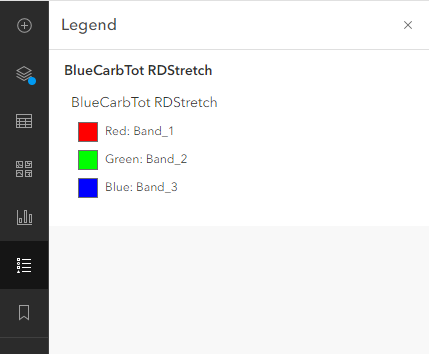
I am wandering if this is a bug and if so, is there a workaround because I haven't found one yet. The RGB legend is no good. I need to create an Experience Builder application using this map and I need a valid (dynamic) legend that depicts the max min values in the image.
I have tried to publish the image service with classified symbology, but I still get the same RGB legend!
I was able to use a user defined renderer in the web map and select a stretch symbology, which produces the correct legend and works as long as a custom color ramp isn't needed. Just curious if I am missing something of if any one else has had a similar issue and found a better solution.