Dear Community,
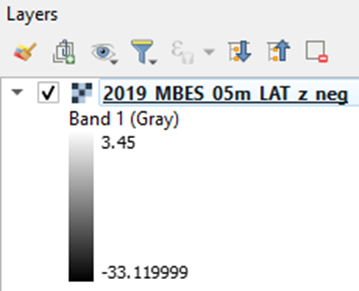
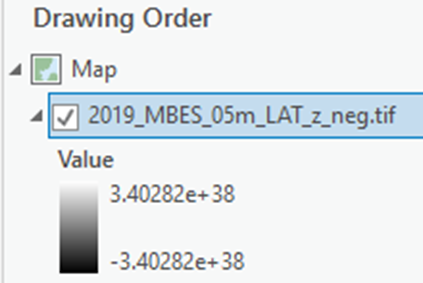
I would like to use a simple raster (1-band) with depth values for the seafloor. Depth range is + 3.5 to - 33.1, so very common numbers. If I drag and drop it into QGIS, in the table of content, the labels for values are shown as 'normal' numbers. If I drag an drop into ArcGIS Pro, the values seem to be shown with scientific notification ("3.40282e+38" for upper and lower value (?!?)). How can this be avoided?
After choosing 'stretched symbology' and 'calculating statistics' the numbers are shown as in QGIS, but only after removing the TIF and loading it a second time. This can't be the normal way, can it?
Thank you in advance for any advice!
BR, Claudia
Thank you in advance for any advice!


