Hello there!
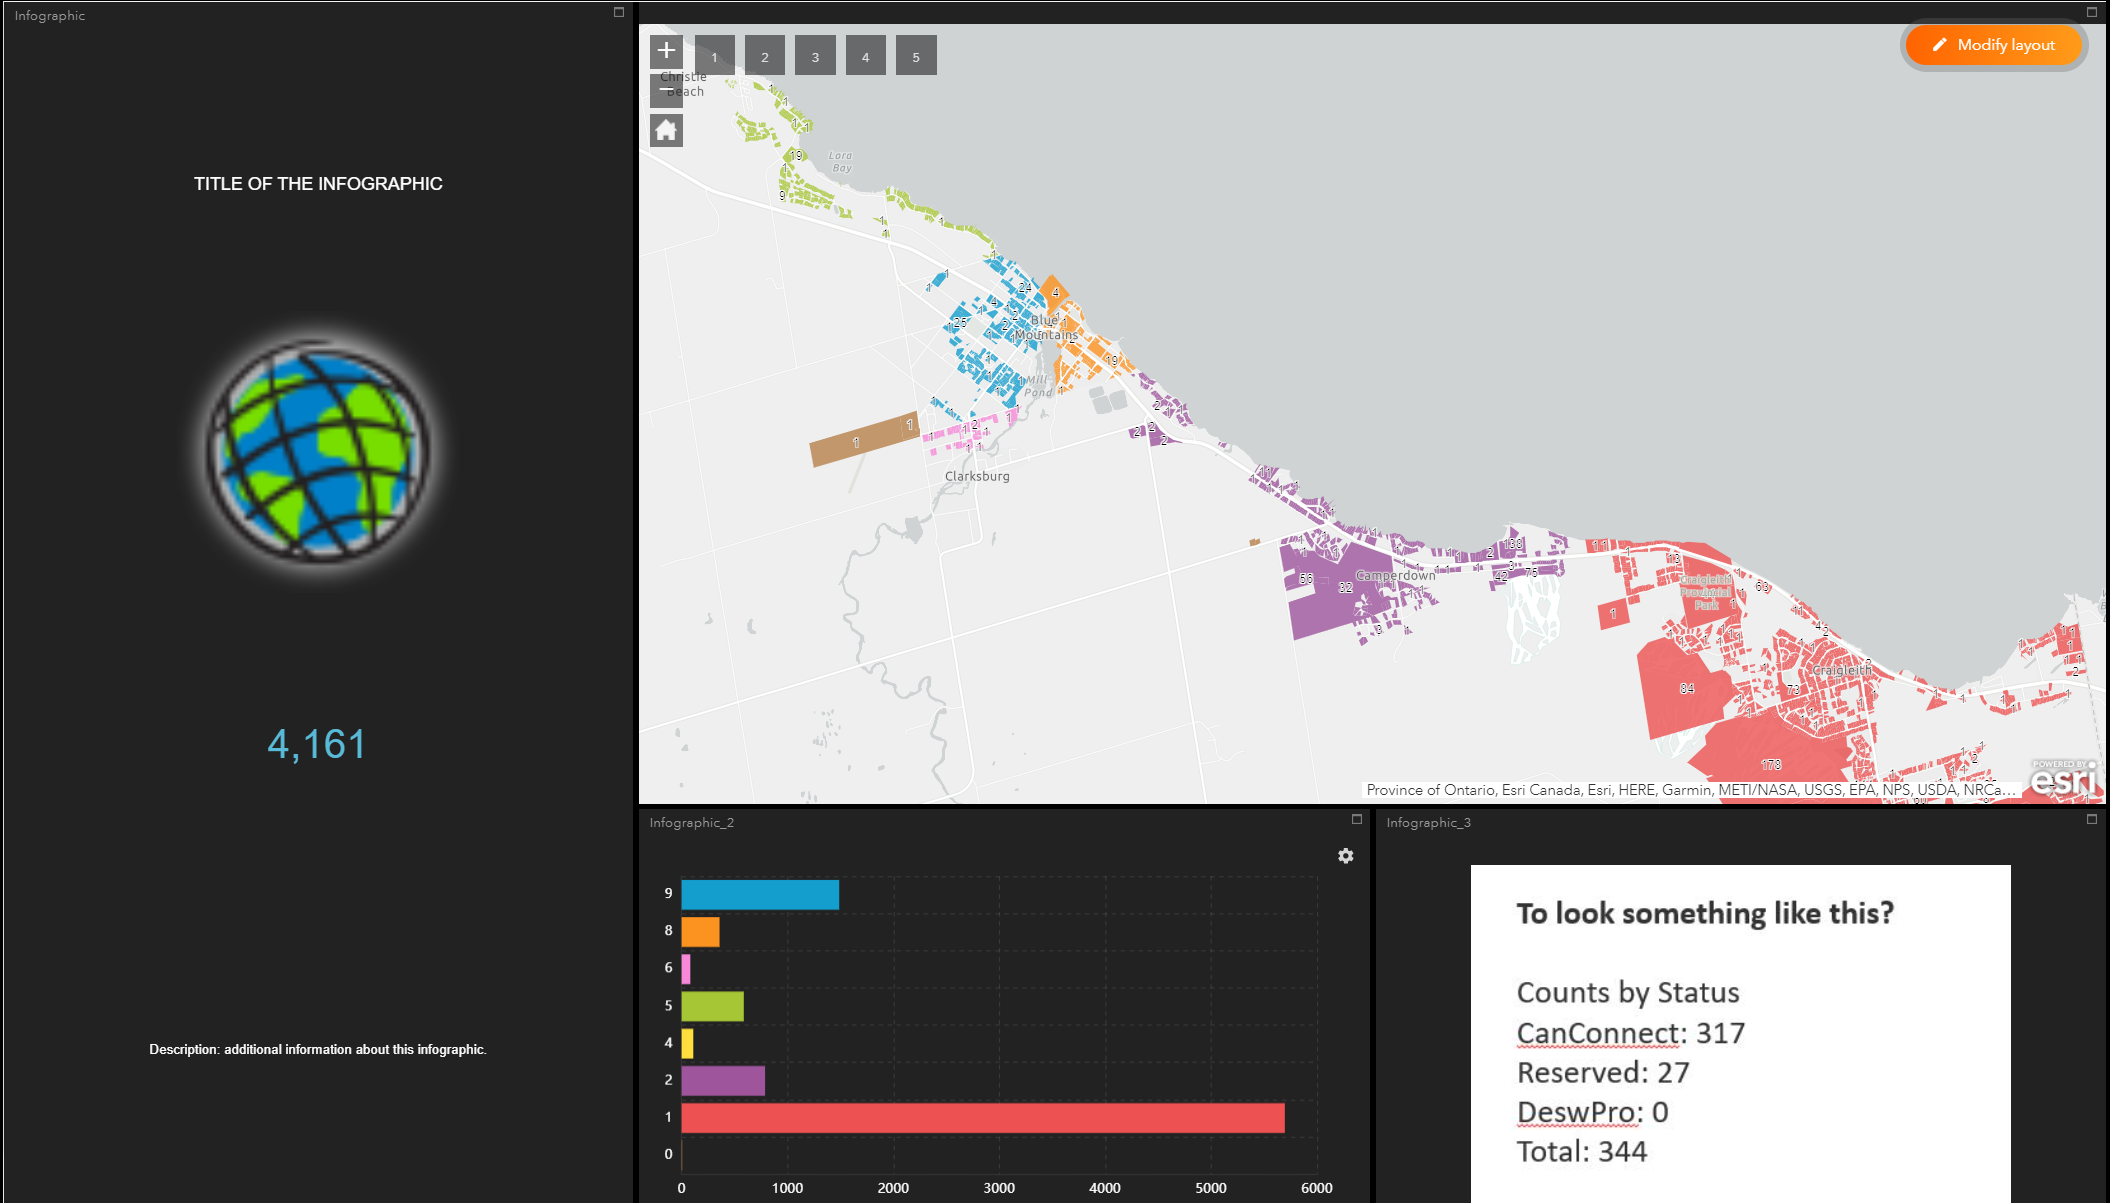
is it possible to display an arcade expression like the example below in one of the ArcOnline Dashboard items? Indicator , Items , Details or Rich Text?
basically I would like to display summarized data on a dashboard - charts and graphs work but not ideal - just want to display the values
var sql = "ServiceAre_1 IN (2,5,6,8,9)";
var fs = Filter ($layer,sql);
var CanC = sum(fs, "F_CanConne_1");
var Reserved = sum(fs, "F_Reserved_1");
var DeswPro = sum(fs, "F_Des_Wpro_1");
var Total = Canc + Reserved + DeswPro;
var result = "CanConnect: " + CanC;
result += TextFormatting.NewLine + "Reserved: " + Reserved;
result += TextFormatting.NewLine + "DeswPro: " + DeswPro;
result += TextFormatting.NewLine + "Total: " + Total;
return result;
Result:
CanConnect: 317
Reserved: 27
DeswPro: 0
Total: 344
end result something like this?