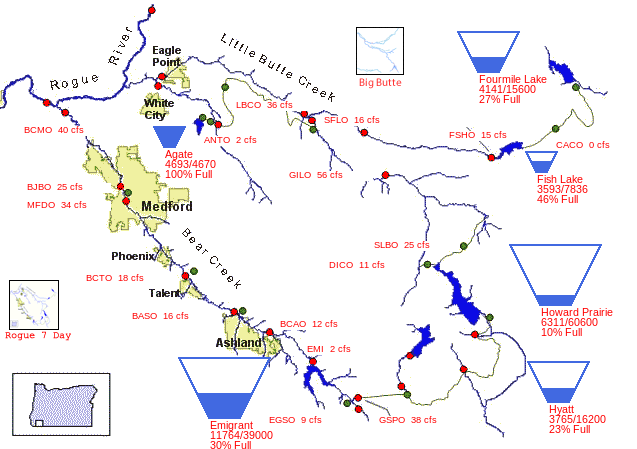
I want to fill a symbol or on a map or a filled shape chart using esri data.
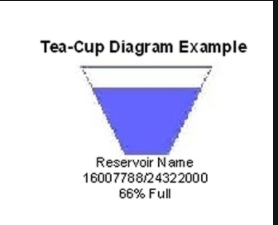
I have been requested to make it like a tea cup diagram.
I know this is a static image but was wondering if there is a way to do this dynamically.
https://www.usbr.gov/pn/hydromet/roguetea.html
You should be able to accomplish this using CIMSymbols. Here's an example: https://developers.arcgis.com/javascript/latest/sample-code/cim-primitive-overrides/
@AnneFitz Do they have to be dots or can they be a different symbol?
No they don't have to be dots! Can be any point symbol - or lines and polygons can follow the same pattern, using CIM primitive overrides to override the symbol properties based on data values.
@AnneFitz I will look into this thanks
@RickeyFight Did you end up figuring out a solution to creating a tea cup diagram? I am currently trying to create the exact same thing. I've created a tea cup with the CIMSymbols but trying to figure out an efficient solution for filling the cups.
This blog might be some help - https://www.esri.com/arcgis-blog/products/js-api-arcgis/mapping/how-to-create-a-sparkline-map-with-the-arcgis-api-for-javascript/
In this app, the developers updated the underlying geometry of the vector marker symbol to create a sparkline based on the provided data. I think a similar concept could probably be applied in order to fill the teacup.Keep me updated on your progress! Would love to see the finished product.
@PeterPucz I did not.I ended up using esri dashboard and making this https://experience.arcgis.com/experience/4a5e89ec2e1b4757990d23b31b38c07f/page/Page-1/
Angemeldete Mitglieder können Beiträge verfassen, Updates folgen und mehr. Neu hier? Registriere ein kostenloses Konto.
Find useful guides, FAQs, and documents to help you navigate and make the most of Esri Community.