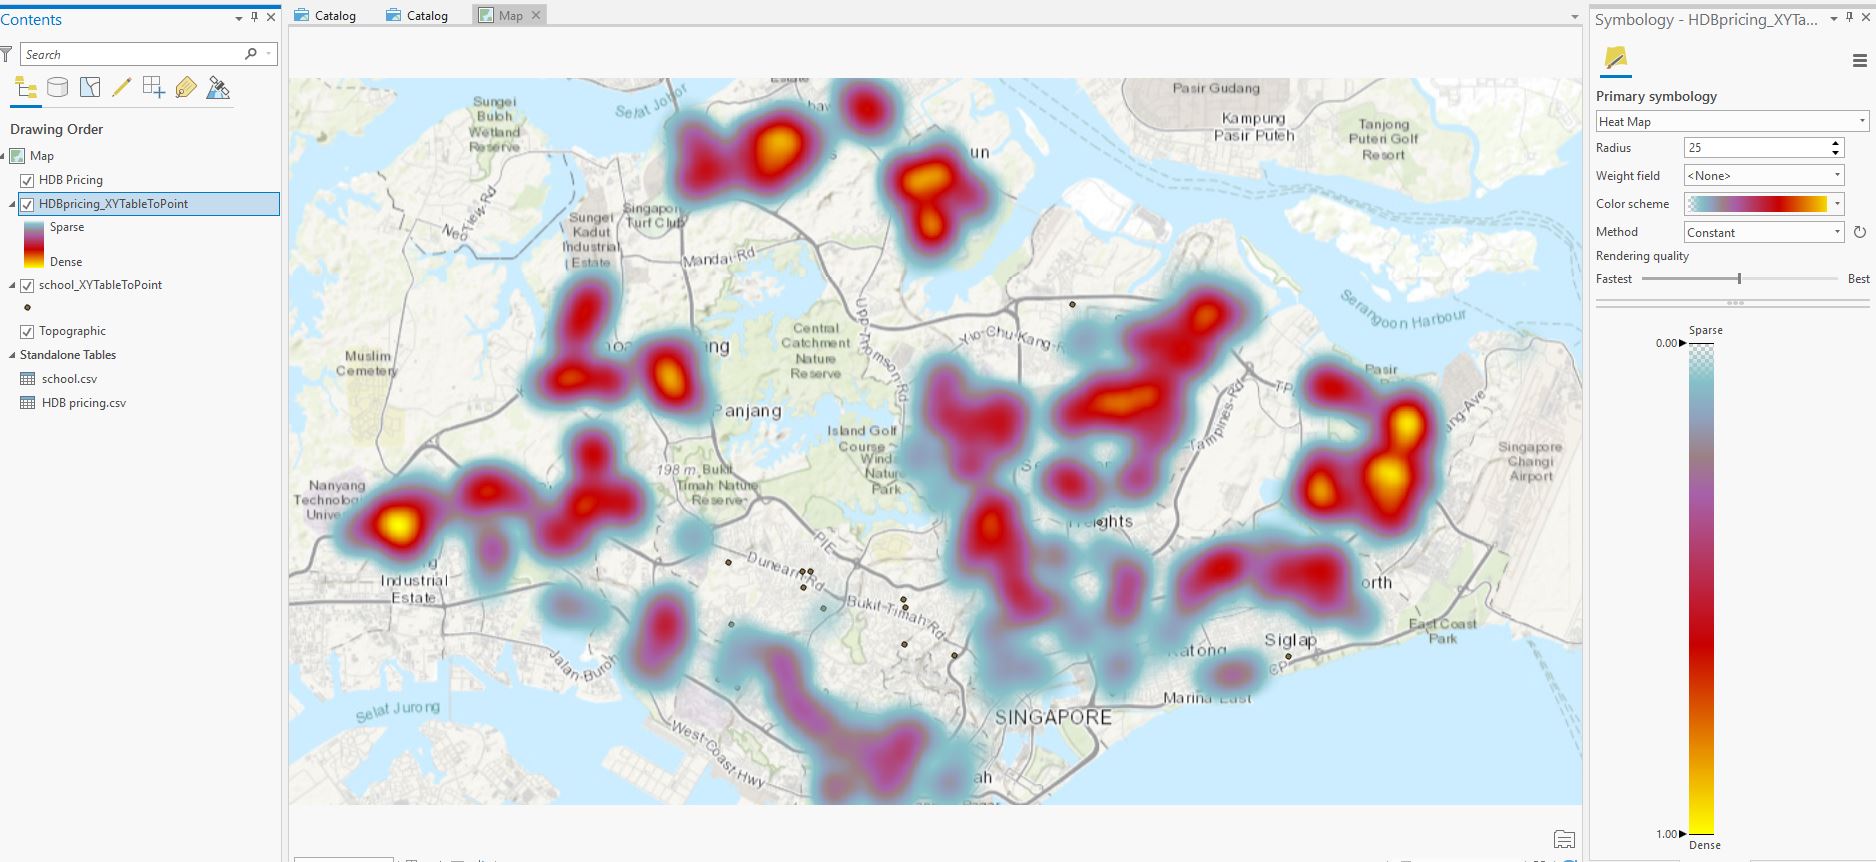
How to add a layer that shows heatmap with resale price.
How to add a time animation to shows the resale price changes throughout the time period.
Table data format:
| HDB Location | Years | Datetime | Average of resale_price | Lon | Lat |
| 1 BEACH ROAD SINGAPORE | 2000 | 1/1/2000 | 178750 | 103.8645218 | 1.3034886 |
| 1 BEACH ROAD SINGAPORE | 2001 | 1/1/2001 | 174166.6667 | 103.8645218 | 1.3034886 |
| 1 BEACH ROAD SINGAPORE | 2002 | 1/1/2002 | 180333.3333 | 103.8645218 | 1.3034886 |
| 1 BEACH ROAD SINGAPORE | 2003 | 1/1/2003 | 201833.3333 | 103.8645218 | 1.3034886 |
| 1 BEACH ROAD SINGAPORE | 2004 | 1/1/2004 | 193000 | 103.8645218 | 1.3034886 |
| 1 BEACH ROAD SINGAPORE | 2005 | 1/1/2005 | 180000 | 103.8645218 | 1.3034886 |
| 1 BEACH ROAD SINGAPORE | 2006 | 1/1/2006 | 222500 | 103.8645218 | 1.3034886 |
| 1 BEACH ROAD SINGAPORE | 2007 | 1/1/2007 | 209500 | 103.8645218 | 1.3034886 |
Thanks