Hi,
We have installed and configure all the components in ArcGIS Monitor 2023.3.1. While preparing a custom ArcGIS Monitor Dashboard we observed that ArcGIS Monitor is not able to fetch the data for the past week and the past month as example we wanted to create graphs or the pie charts for the below scenarios:
1. Total number of contents created last week and last month.
2. Total number of groups created last week and last month.
3. Total number of users (Categorize by user types) onboarded last week and last month.
Below are the screenshots for the queries that we have configured for total number of contents created last week but still we can see in the graph total number of contents created till date.
1: Configured Query
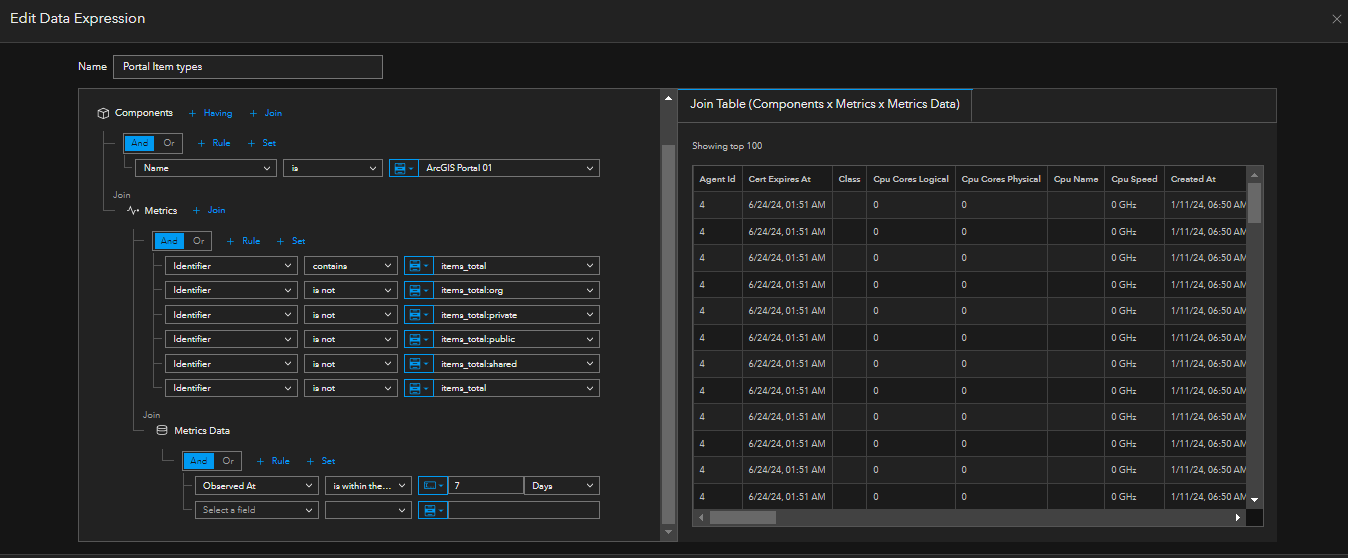
2. Output Pie Chart:
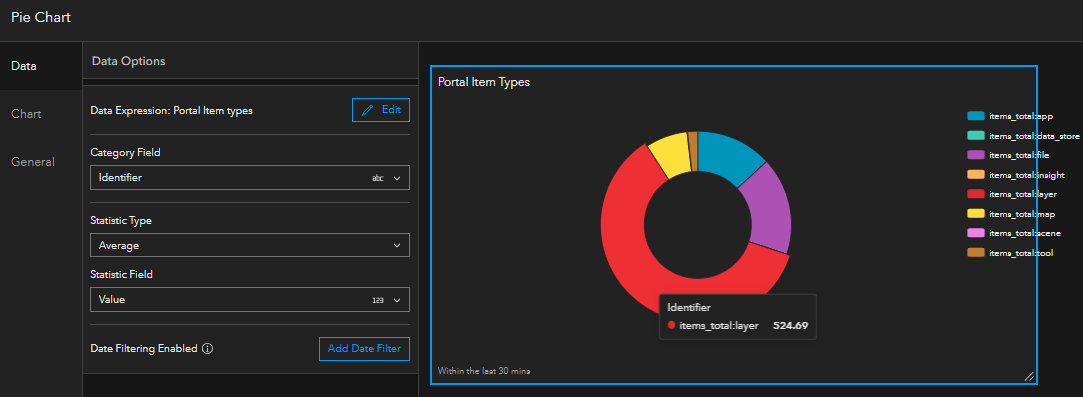
Here we can see the number of layers till date and value of the number layer shows in decimal format.
Is this a defect or enhancement or if I am missing something in the configured query.
Any help would be highly appreciated!
Thanks,
Varun


