I would like to produce a map like this:
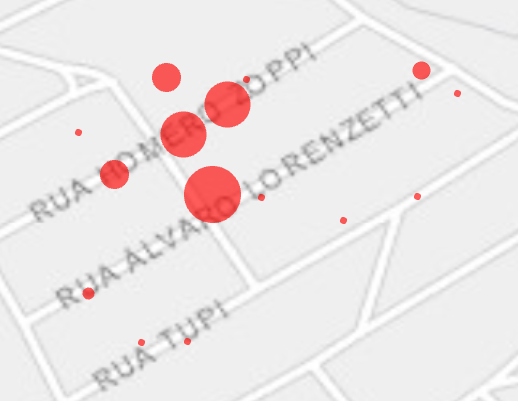
I have a spatially enabled data frame with a column with numeric values (integers). I want vary the size of the symbol by value. I have found documentation for changing colors, which works fine, but I can't figure out how to change size.
Here is my current code:
red_rel<SPAN class="punctuation token">.</SPAN>spatial<SPAN class="punctuation token">.</SPAN>plot<SPAN class="punctuation token">(</SPAN>map_widget<SPAN class="operator token">=</SPAN> m3<SPAN class="punctuation token">,</SPAN>
renderer_type <SPAN class="operator token">=</SPAN> <SPAN class="string token">'c'</SPAN><SPAN class="punctuation token">,</SPAN>
method<SPAN class="operator token">=</SPAN><SPAN class="string token">'esriClassifyNaturalBreaks'</SPAN><SPAN class="punctuation token">,</SPAN>
class_count<SPAN class="operator token">=</SPAN><SPAN class="number token">20</SPAN><SPAN class="punctuation token">,</SPAN>
col<SPAN class="operator token">=</SPAN><SPAN class="string token">'MARK_Red'</SPAN><SPAN class="punctuation token">)</SPAN><SPAN class="line-numbers-rows"><SPAN></SPAN><SPAN></SPAN><SPAN></SPAN><SPAN></SPAN><SPAN></SPAN></SPAN>I imagine it is a matter of changing the 'c' in renderer_type to something else but I haven't figured out what that is. There should also be a way to set a size range.
Many Thanks.
also, is there a way to clear the symbology so each time I run the script it doesn't just overwrite the previous symbology?
ArcGIS API for Python v. 1.6
Jupyter Lab v. 0.35.4


