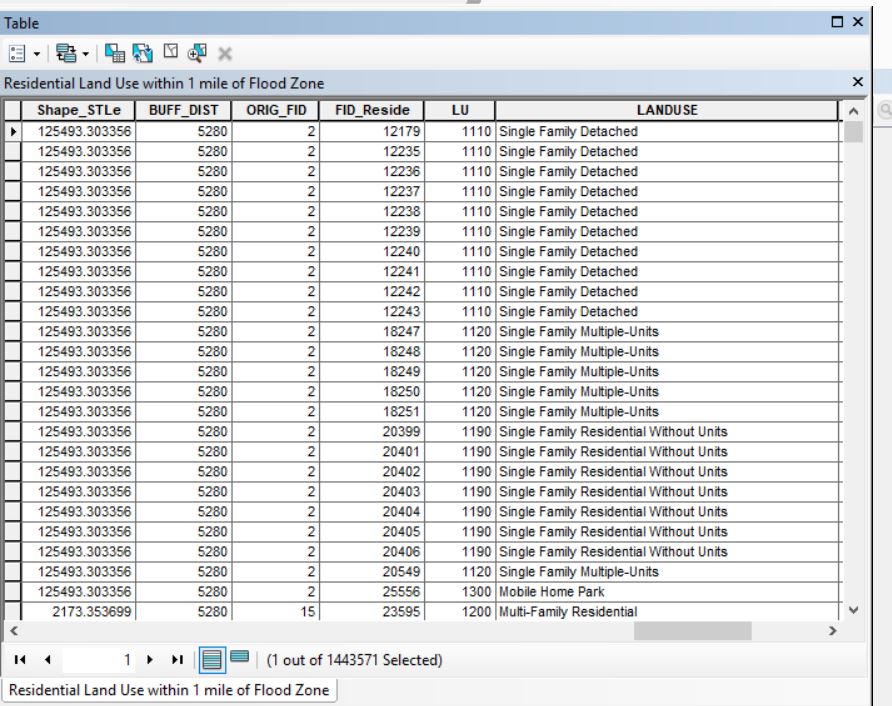
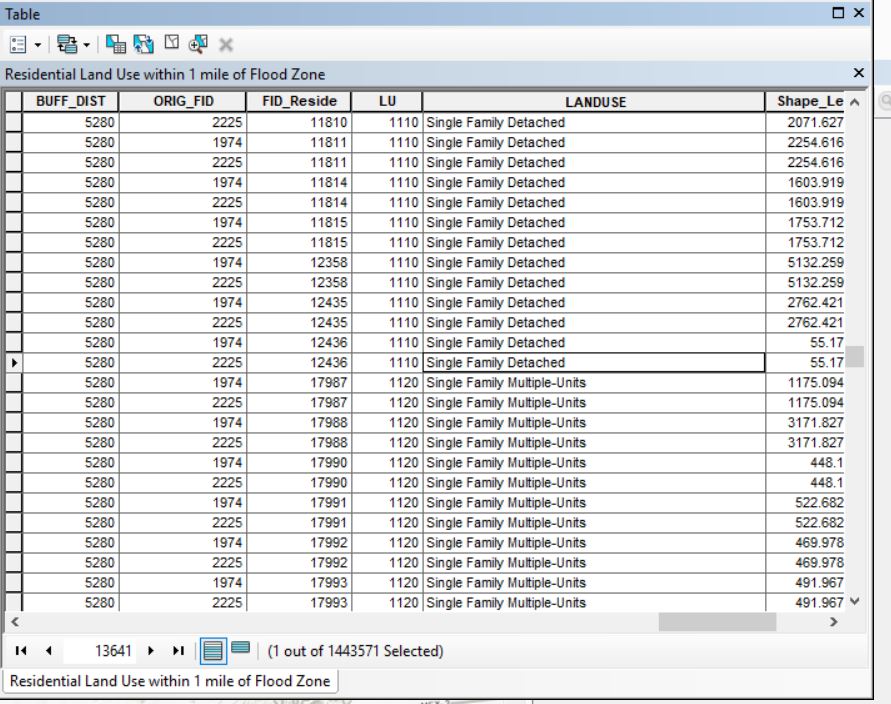
I'm taking an intro GIS course where we had to make a final map project. I ran a buffer of flood zones to see what residential parcels are within a 1 mile radius. The output has duplicated some of the zones. How can I simplify my data so the parcels are only listed once. I want to make a graph to show what percent of all residential parcels are at risk for flooding.