I am trying to alter a rather large dataset about solar radiation across the US.
https://arcg.is/0fvmu5
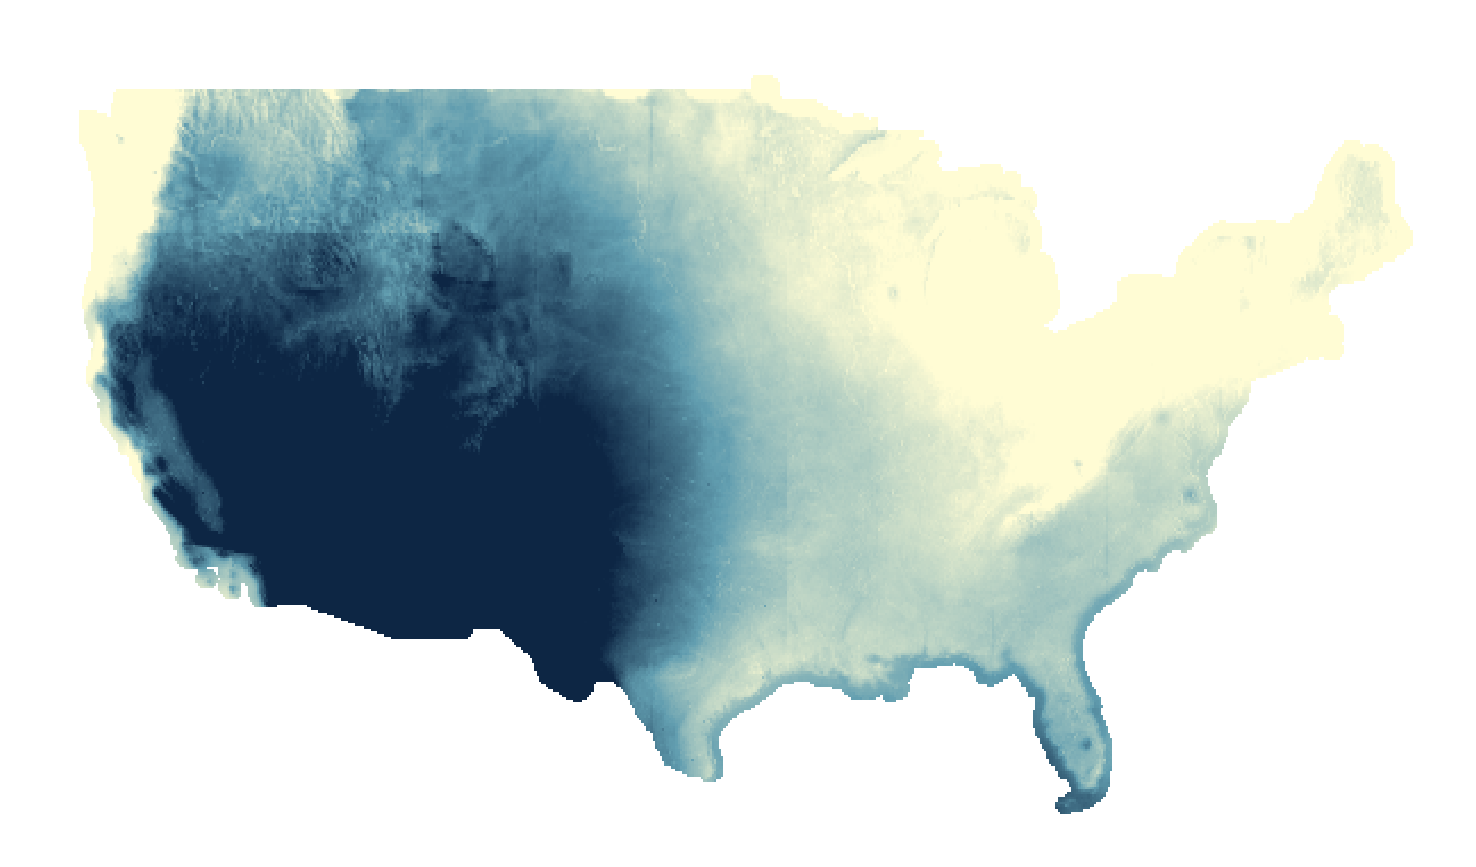
This map was downloaded from the NREL as a zip file. The table has an ID, Gridcode, Long, Lat, etc. The data is gridded into 10km by 10km squares.
GIS recognizes this layer as a Polygon layer, and gives me quite a few styling options to represent it.
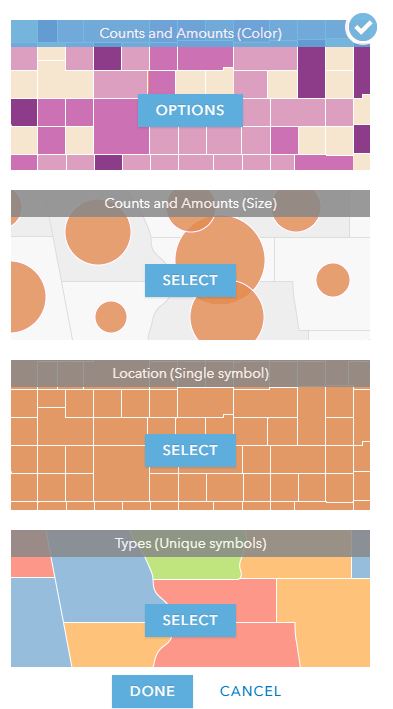
I wanted to calculate an optimal tilt for solar panels based on Latitude and add it to my pop-ups. I exported the map's table as a CSV and did this calculation in Excel. The new table is identical to the one I exported except that it has a new column that is the optimal tilt.
I imported this new table back into ArcGIS online, however, it uploaded as a point layer instead of a polygon layer. When mapping any data, it represents my data as points instead of polygons.
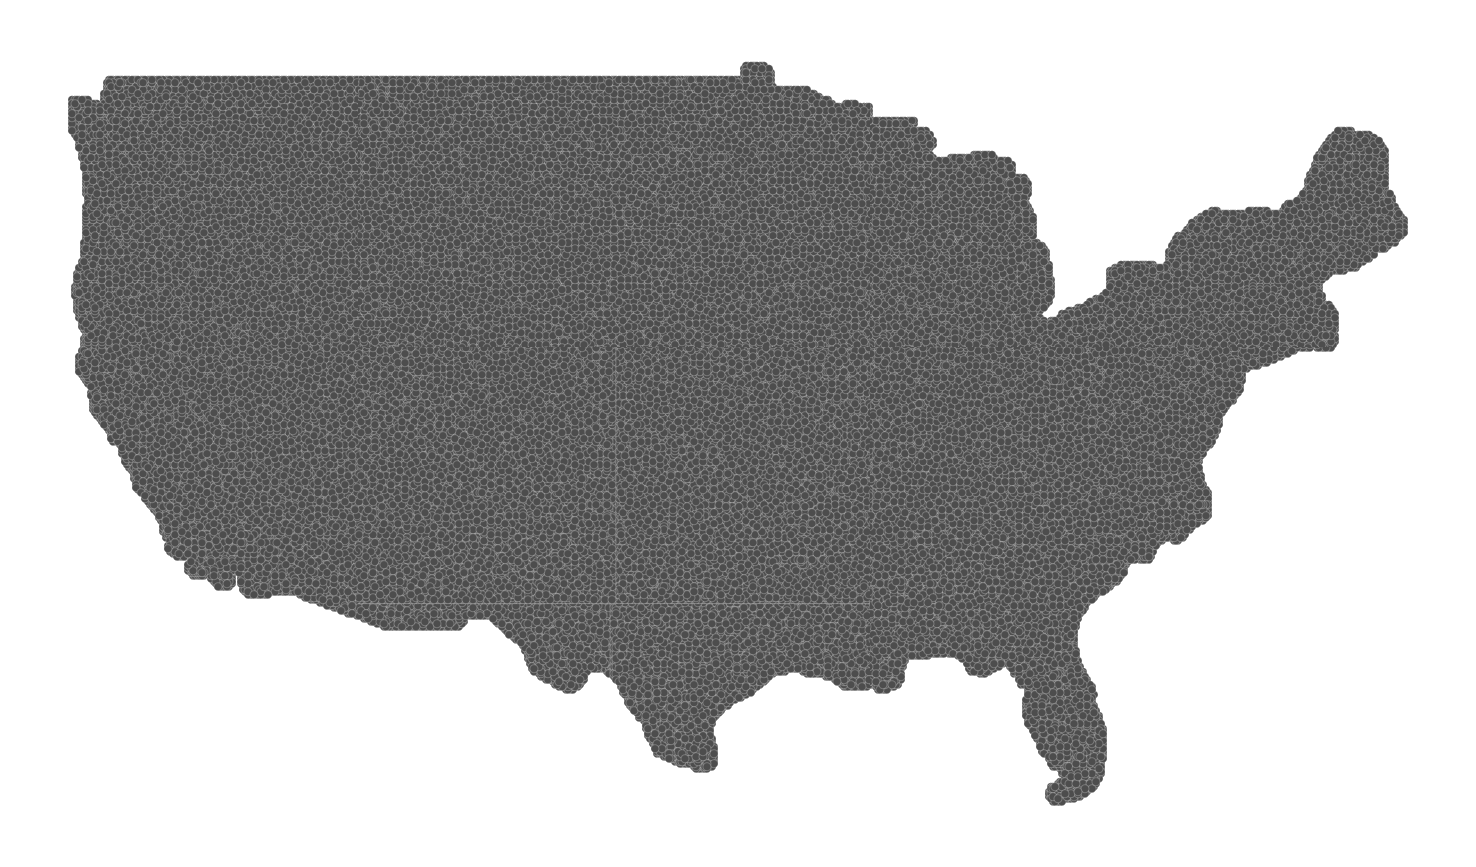
Singular points still represent a square area of 10km by 10km. The data is actually identical to my previous map (save for the new addition). I only have two styling options, neither of which represent my data efficiently.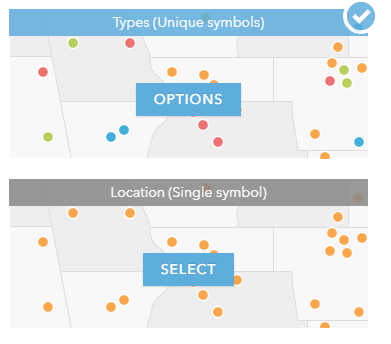
As I stated previously, GIS lists this new feature layer as a point layer instead of a polygon layer. I am confused as to why this is the case. Is there a way that I can change this to a polygon layer so that I have more options in visually representing this data?
Tldr: GIS online views my feature layer as a point layer. I want GIS to view my point layer as a Polygon layer.


