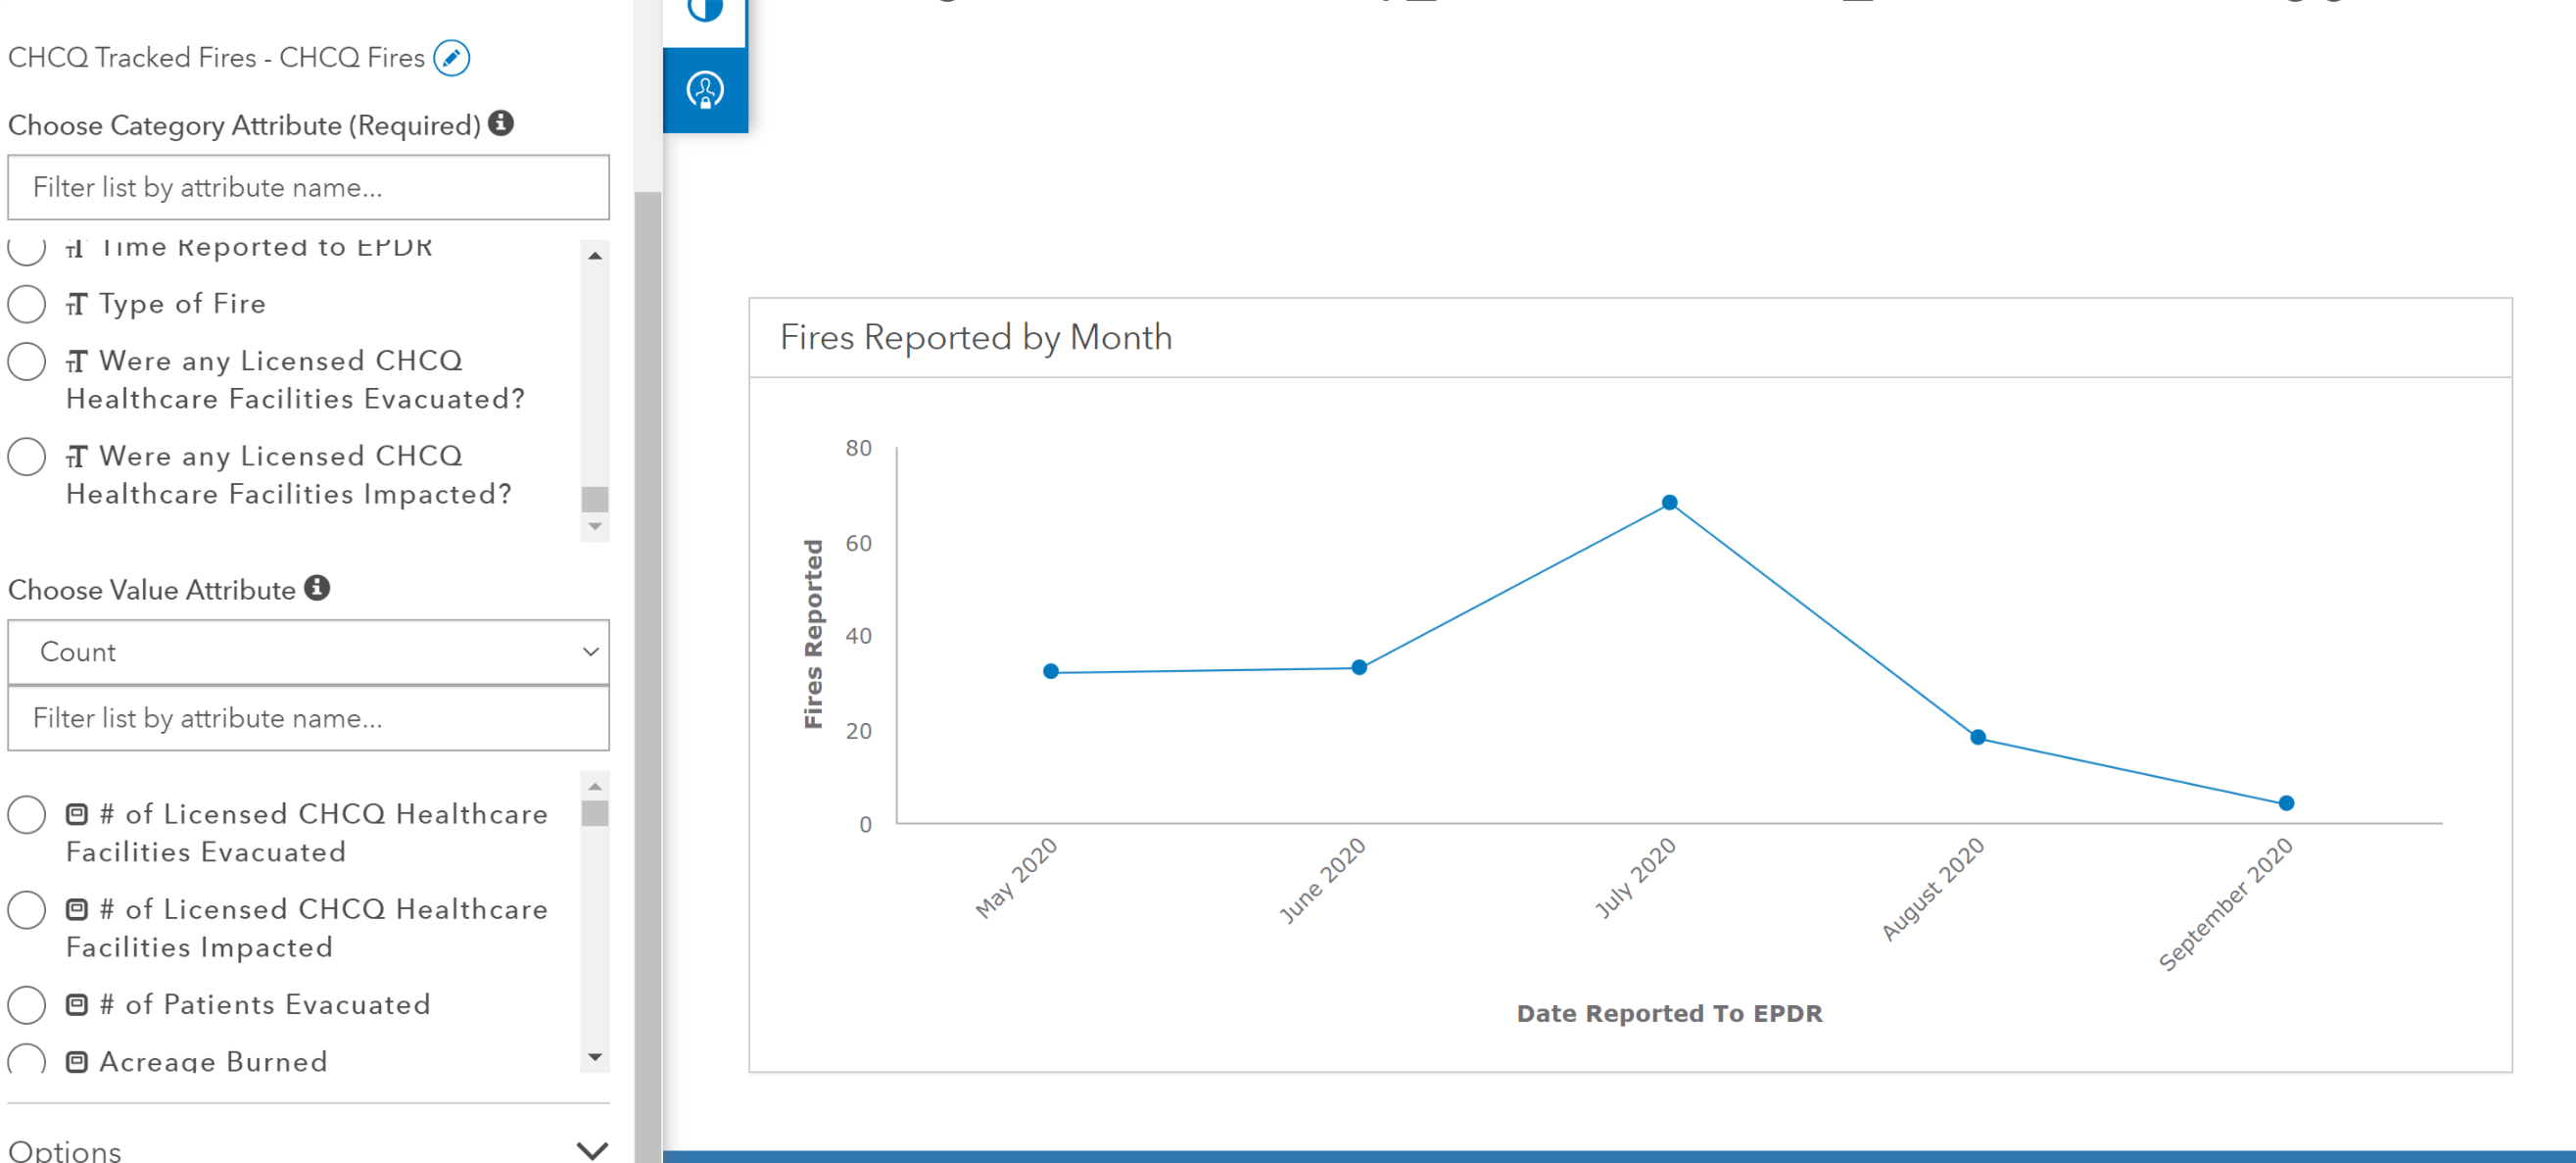
when doing a line graph with a chart card, the months that are being displayed are not correct. For example my date 6/2/2020 is being counted as May on the chart. Was wondering if this is a common issue as i dont think it in correct in my layer feeding the chart. In the picture May is displaying 32, but those should actually be for June.