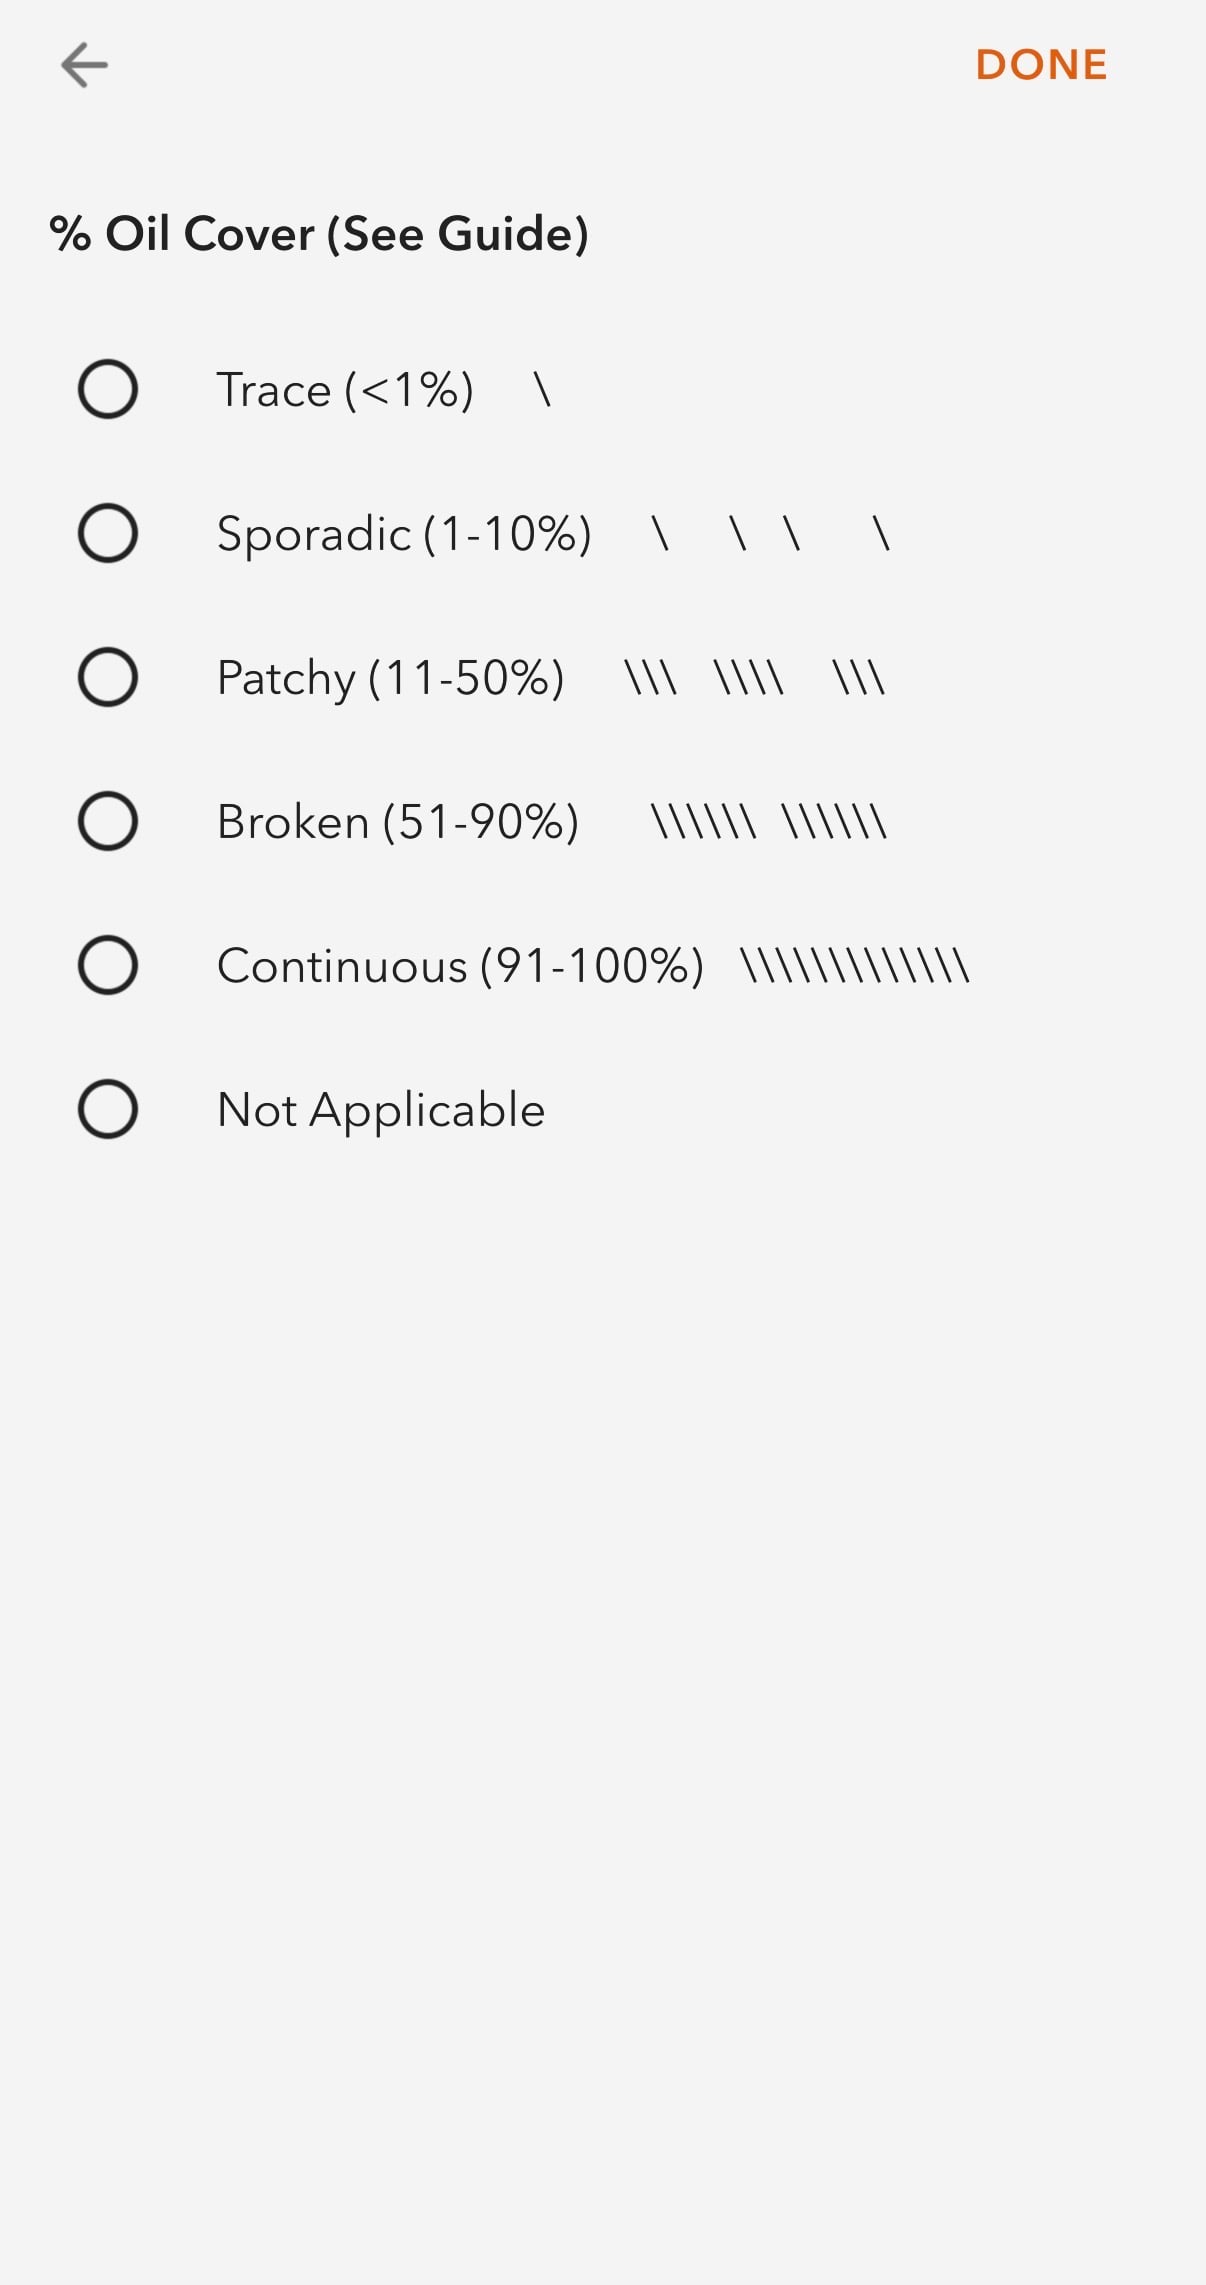
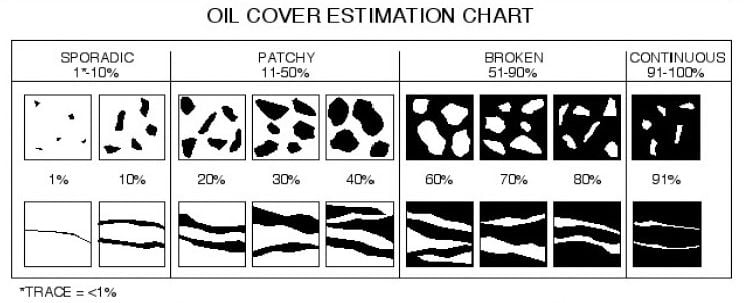
In our QuickCapture app to be used for surveying shorelines during an oil spill response, we have a question that asks the user to determine the percent cover of oil. It would be so helpful if we could display a graphic for this question that guides the user in choosing the appropriate answer. Currently, we do this with a series of slashes (first image), but it would be much better if we could display the graphic (second image) somewhere on that page. Is this possible? If not, any suggestions?