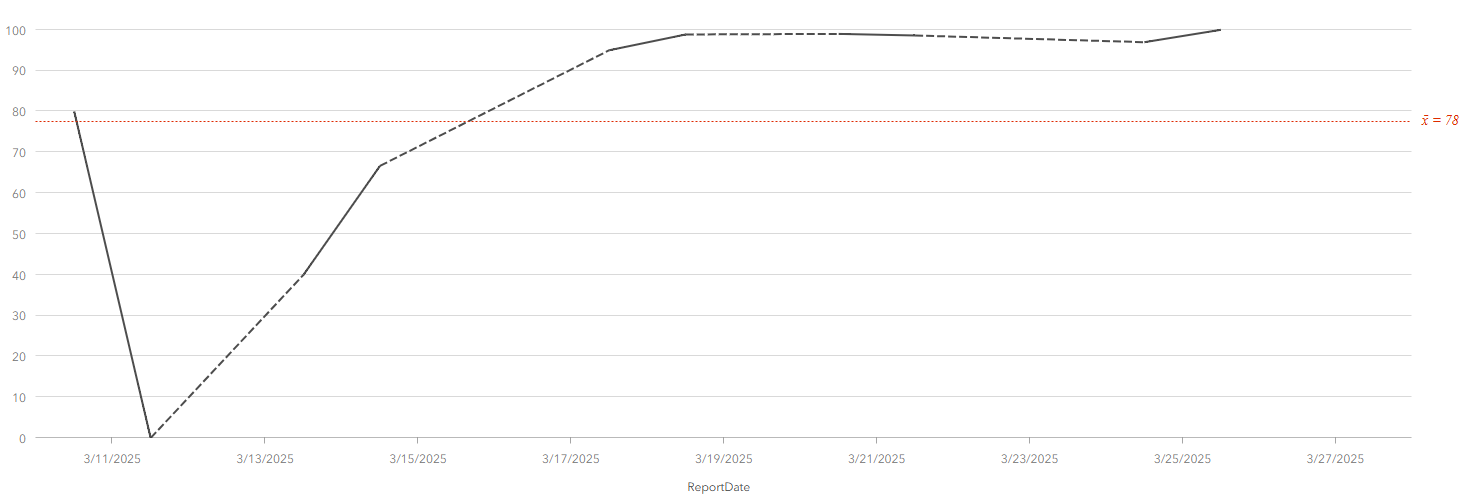
Is there a way to create a trend or average line in a serial chart? I know you can create a guide line, but that's not quite what I'm looking for. I know in ArcGIS Insights you can create a line to show the average of the chart, but since Insights is being retired I'm trying to avoid creating new items with it. Below is an screenshot of the Insights chart with the average line. Thanks for any help!