I am trying to symbolize polygons from point data in a web map. I was able to do this in a pop-up (see code below), but I would like to bring those counts/values and symbolize the county polygon it is associated with.
Code for pop-up:
var essential_facilities = FeatureSetByName($map, "Essential Facilities", ['FacilityTy', 'County', 'FunctDay1'], false);

// Intersect selected feature with Intensity Feature Set
var intersectEssentialFacility = Intersects(Geometry($feature), essential_facilities);

// Populate array with Intensity values for selected county where FunctDay1 is less than or equal to 67
var FacilityType = [];
for (var k in intersectEssentialFacility) {
    if (k.FunctDay1 <= 67) {
        Push(FacilityType, k.FacilityTy);
    }
}

return Count(FacilityType);Pop-up for county polygon:
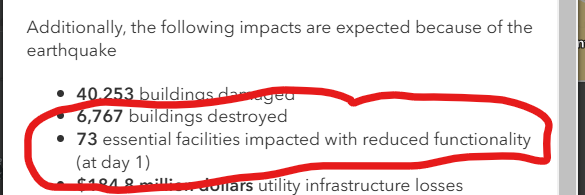
I'd like to symbolize the county polygons (the number of facilities with reduced functionality at day 1) using a similar arcade expression but return an error when doing so:
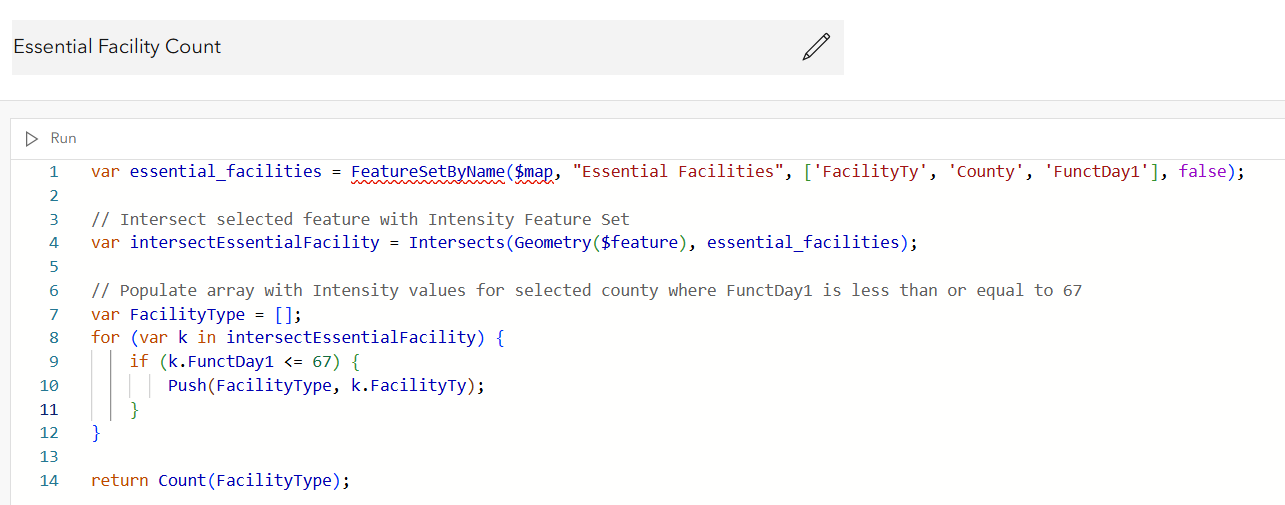
Is this possible to do?

