I am in the process of trying to develop lift station network diagrams within the Sewer Utility Network. The idea is to show all upstream lift stations from a specific starting lift station in a type of tree diagram. My process is as follows. I start with a upstream trace from the target lift station, I then create a set of trace starting points from the upstream lift stations returned. I then run a downstream trace from the starting points returned from the first trace. This returns a simplified path back to the target lift station. The returned downstream trace selection only includes lift stations, interceptor gravity mains, and force mains no other features are selected.
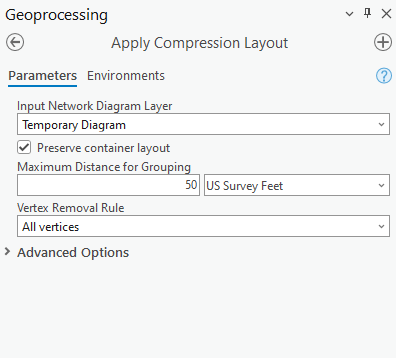
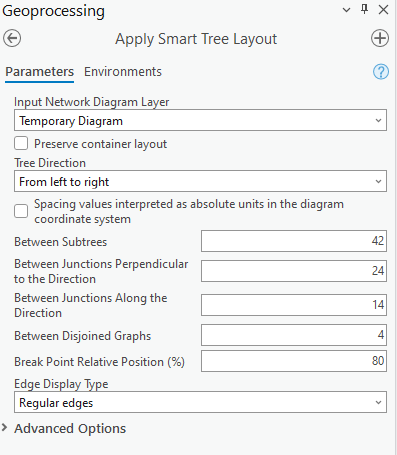
I have a diagram configured to run a Compression Layout then a Smart Tree Layout and also expand/collapse the lift station structure junctions returning them as point features in the diagram. I have included the parameters for each in the images below.
The issue I am trying to find a solution for is if there is a way to lessen or aggregate the distance between features in the resulting diagrams. I don't want to represent the accurate distance between features, but only how they are connected. As an example some downstream sections of lift stations run through a fairly large distance of interceptor gravity main before reaching the next downstream lift station. The issue with this is these sections have many pipe segments as there are splits at manholes this can also happen along force main at valves and other features where the pipes are split. The result in the tree diagram is an extension between features taking up valuable space. I understand it is representing the actual length traveled through these sections in the network, but I am looking to create something more condensed. The goal is to show how the lift stations are connected and the distance and other features in-between aren't as important. I would want the connecting lines in the diagram between lift stations to be all similar length. Is there a way to aggregate the connecting pipes between features? When the diagram is run it will create the junctions in the pipes even if I am not including those features it is "filling in the network gaps" is there anyway around this? Would other layouts or combination of layouts and diagram tools help reach this goal?
Any feedback or ideas on how I can accomplish the type of diagram I am looking for would be very helpful. The need for this type of diagram is for quick reference to visualize how lift stations are connected for example a power outage during a hurricane. The output would be a printed page or digital image of the diagram.
Example: My goal here would be to lessen the distance between Deer Hollow #3 and Deer Hollow #2. This section of Gravity has many segments because of line splits at manholes.

Current Layout Settings for Compression Layout and Smart Tree Layout: