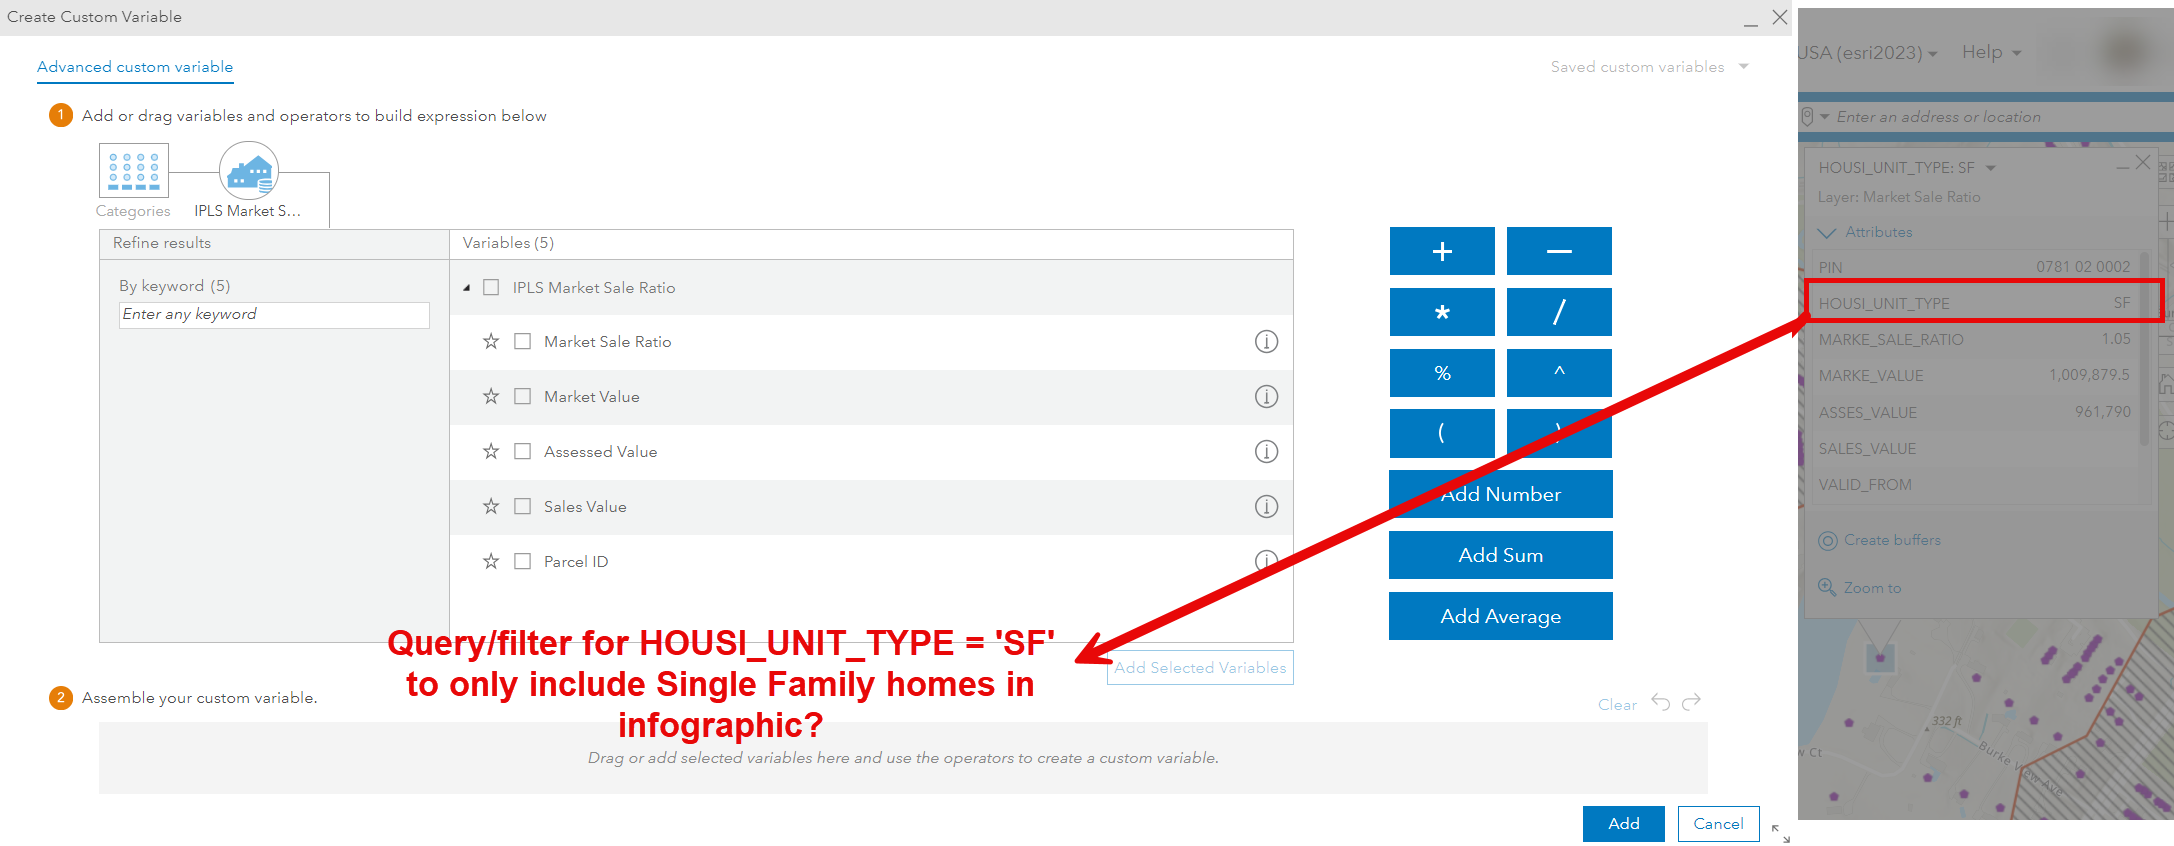
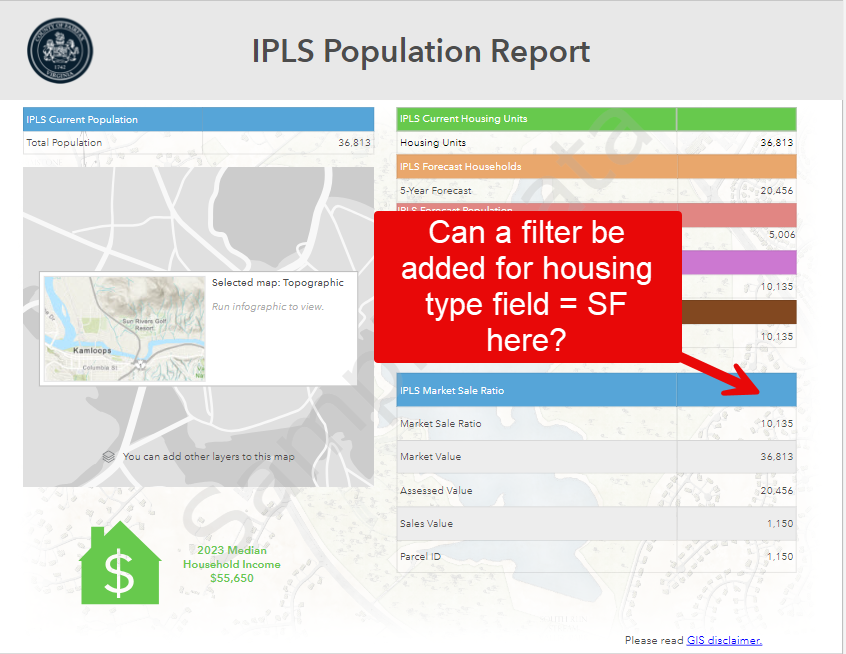
I've created some custom data in the BA web app (enterprise v.10.9.1) and noticed only numerical table attributes can be configured in the data browser, which makes sense. I was wondering if there was a way to access text attributes to limit my infographic results to only calculate values for a certain feature type, e.g., single family home market value in the image below.
Or, maybe this can be done interactively in the infographic output?
I appreciate any help I can get with this.


