I have a map that has a layout with a Reference Grid, with rows 1-26 and Columns A-Z. On the map are 626 point features that are each within a certain cell in the Reference Grid. The point feature attribute table has an empty Column for "GridRef" (Grid Reference).
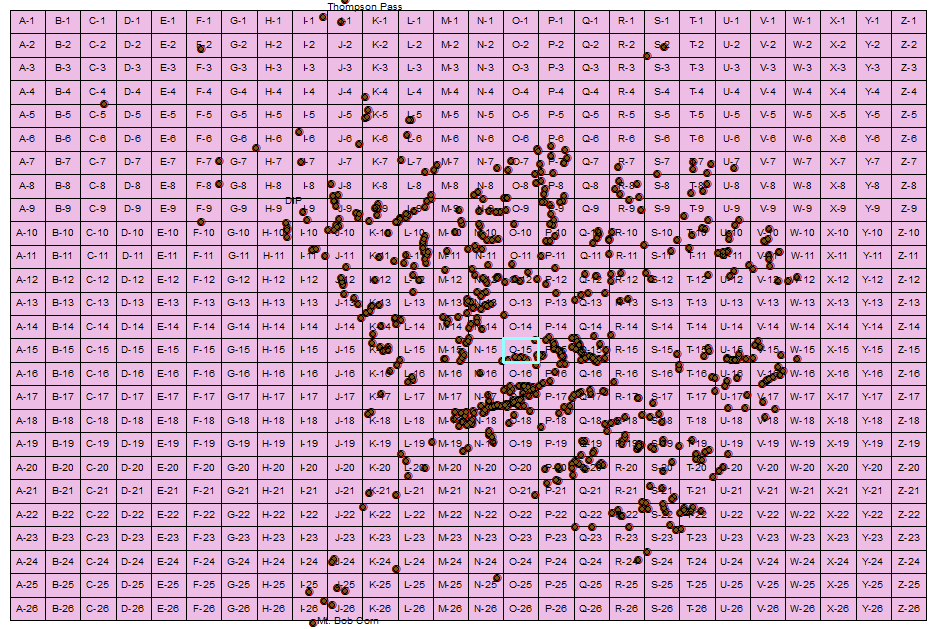
I need to create an index table below the map frame on the eventual printed map that shows where each feature is located in the grid (e.g. "Feature 17 is located in cell G-4").
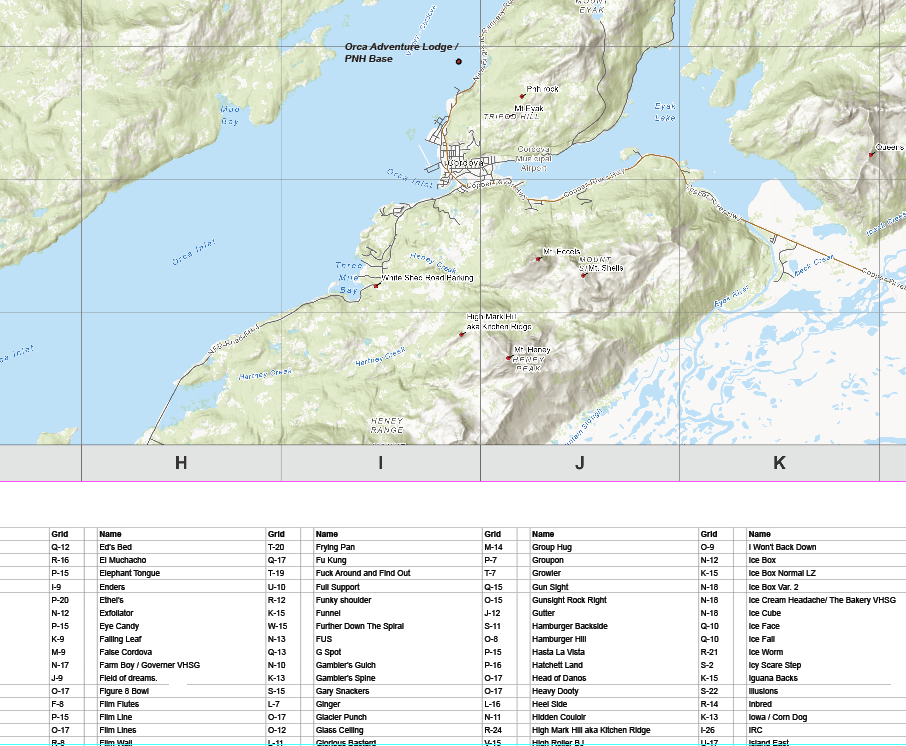
How would I go about 1) appending the location information to the Feature attribute table, and 2) Generating this table on the layout?
The convoluted "workaround" workflow I have developed is:
- Make a fishnet from the Reference Grid with same extent as the reference grid that has 26 rows and 26 columns
- Convert the Fishnet to a polygon feature with 26 rows and 26 columns.
- Manually tag each polygon in the feature with the Row and Column (A-1 through Z-26) in the attribute table, one row and one column at a time with Field Calculator
- Convert the the polygon feature to a Raster with 26 rows and 26 columns, and each raster cell is the same size as a grid block and has the value from the Grid Reference (A-1 through Z-26).
- Extract values to Points to my point feature, from the Raster, and create a new point feature class that has each point's Grid Reference block
- Export this new feature classe's Attribute table as a CSV text file
- Import this table into Google Sheets
- Format and copy and paste the PDF back into the layout.
- Generate map.
There must be a better way, or a tool, to do this extremely common cartographic task. I'm sure I just can't find it. Or perhaps some snazzy Python code.
Can anyone help?

