I have a somewhat similar request as @DaveBodak and would like some insight from @jcarlson from this post: https://community.esri.com/t5/arcgis-dashboards-questions/combining-multiple-categories-in-a-serial-chart/td-p/1146985. here is my request below:
We have a dashboard that is looking at compost procurement for cities in Northern California. I was able to group the feature layer by jurisdiction and join with a jurisdiction table to show how much compost each jurisdiction has collected and how much more they need to collect (from table by jurisdiction):
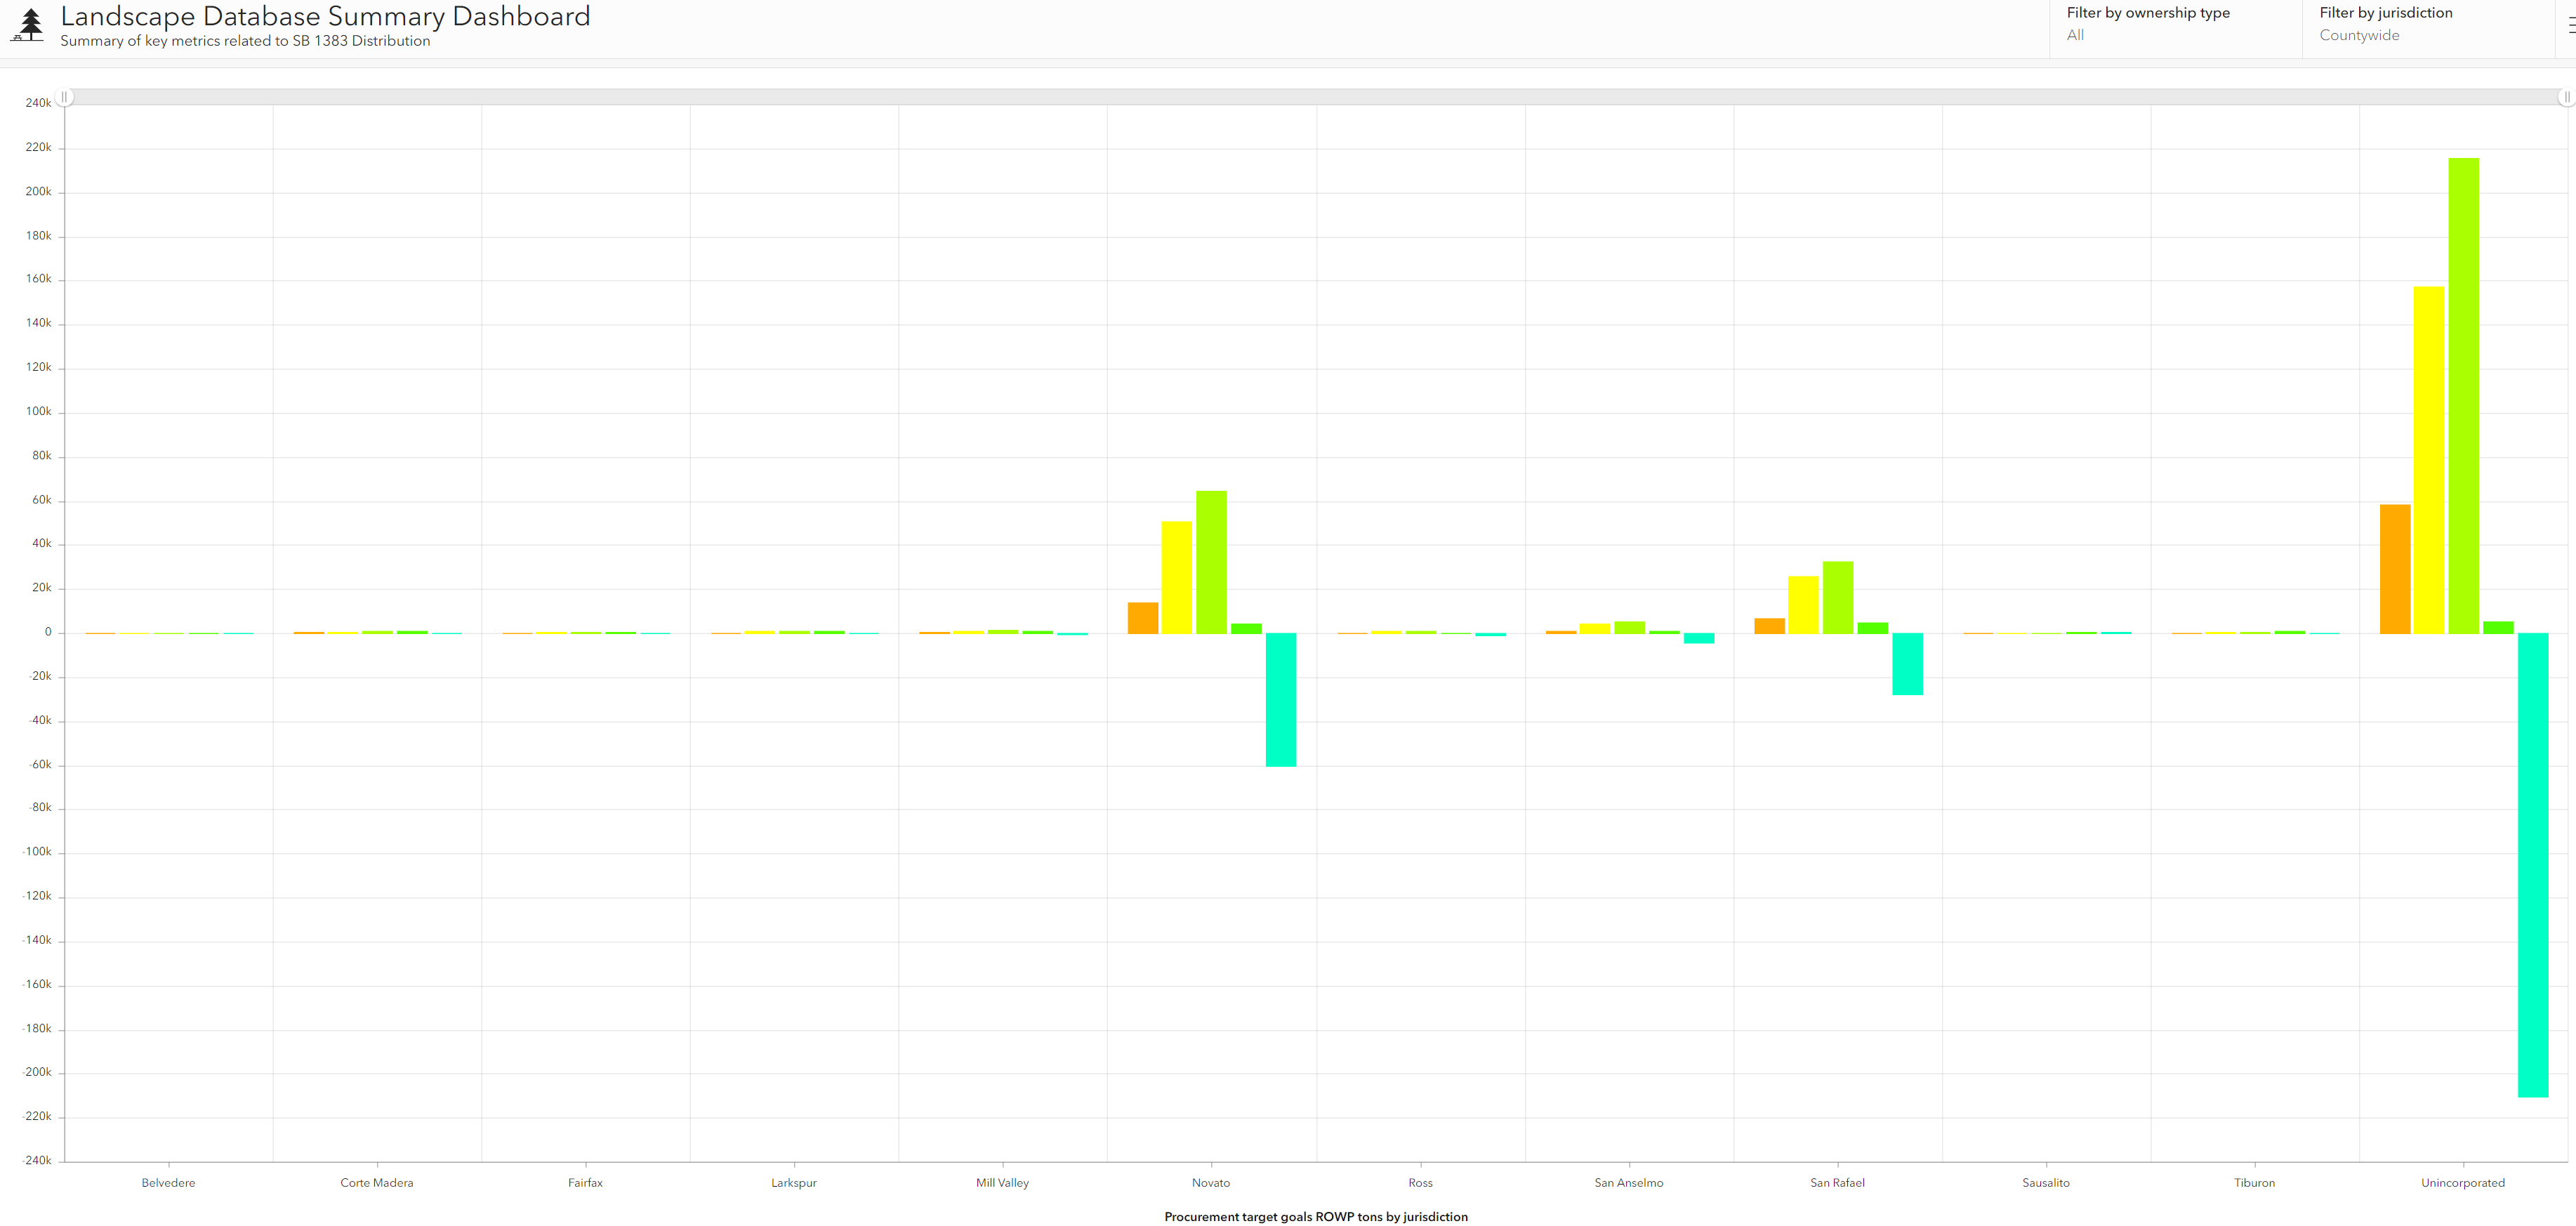
In the top right we filter by serial chart and jurisdiction based on a shared string attribute. I can filter by Novato and the chart changes based on this shared attribute 'Jurisdiction' and 'Name'.
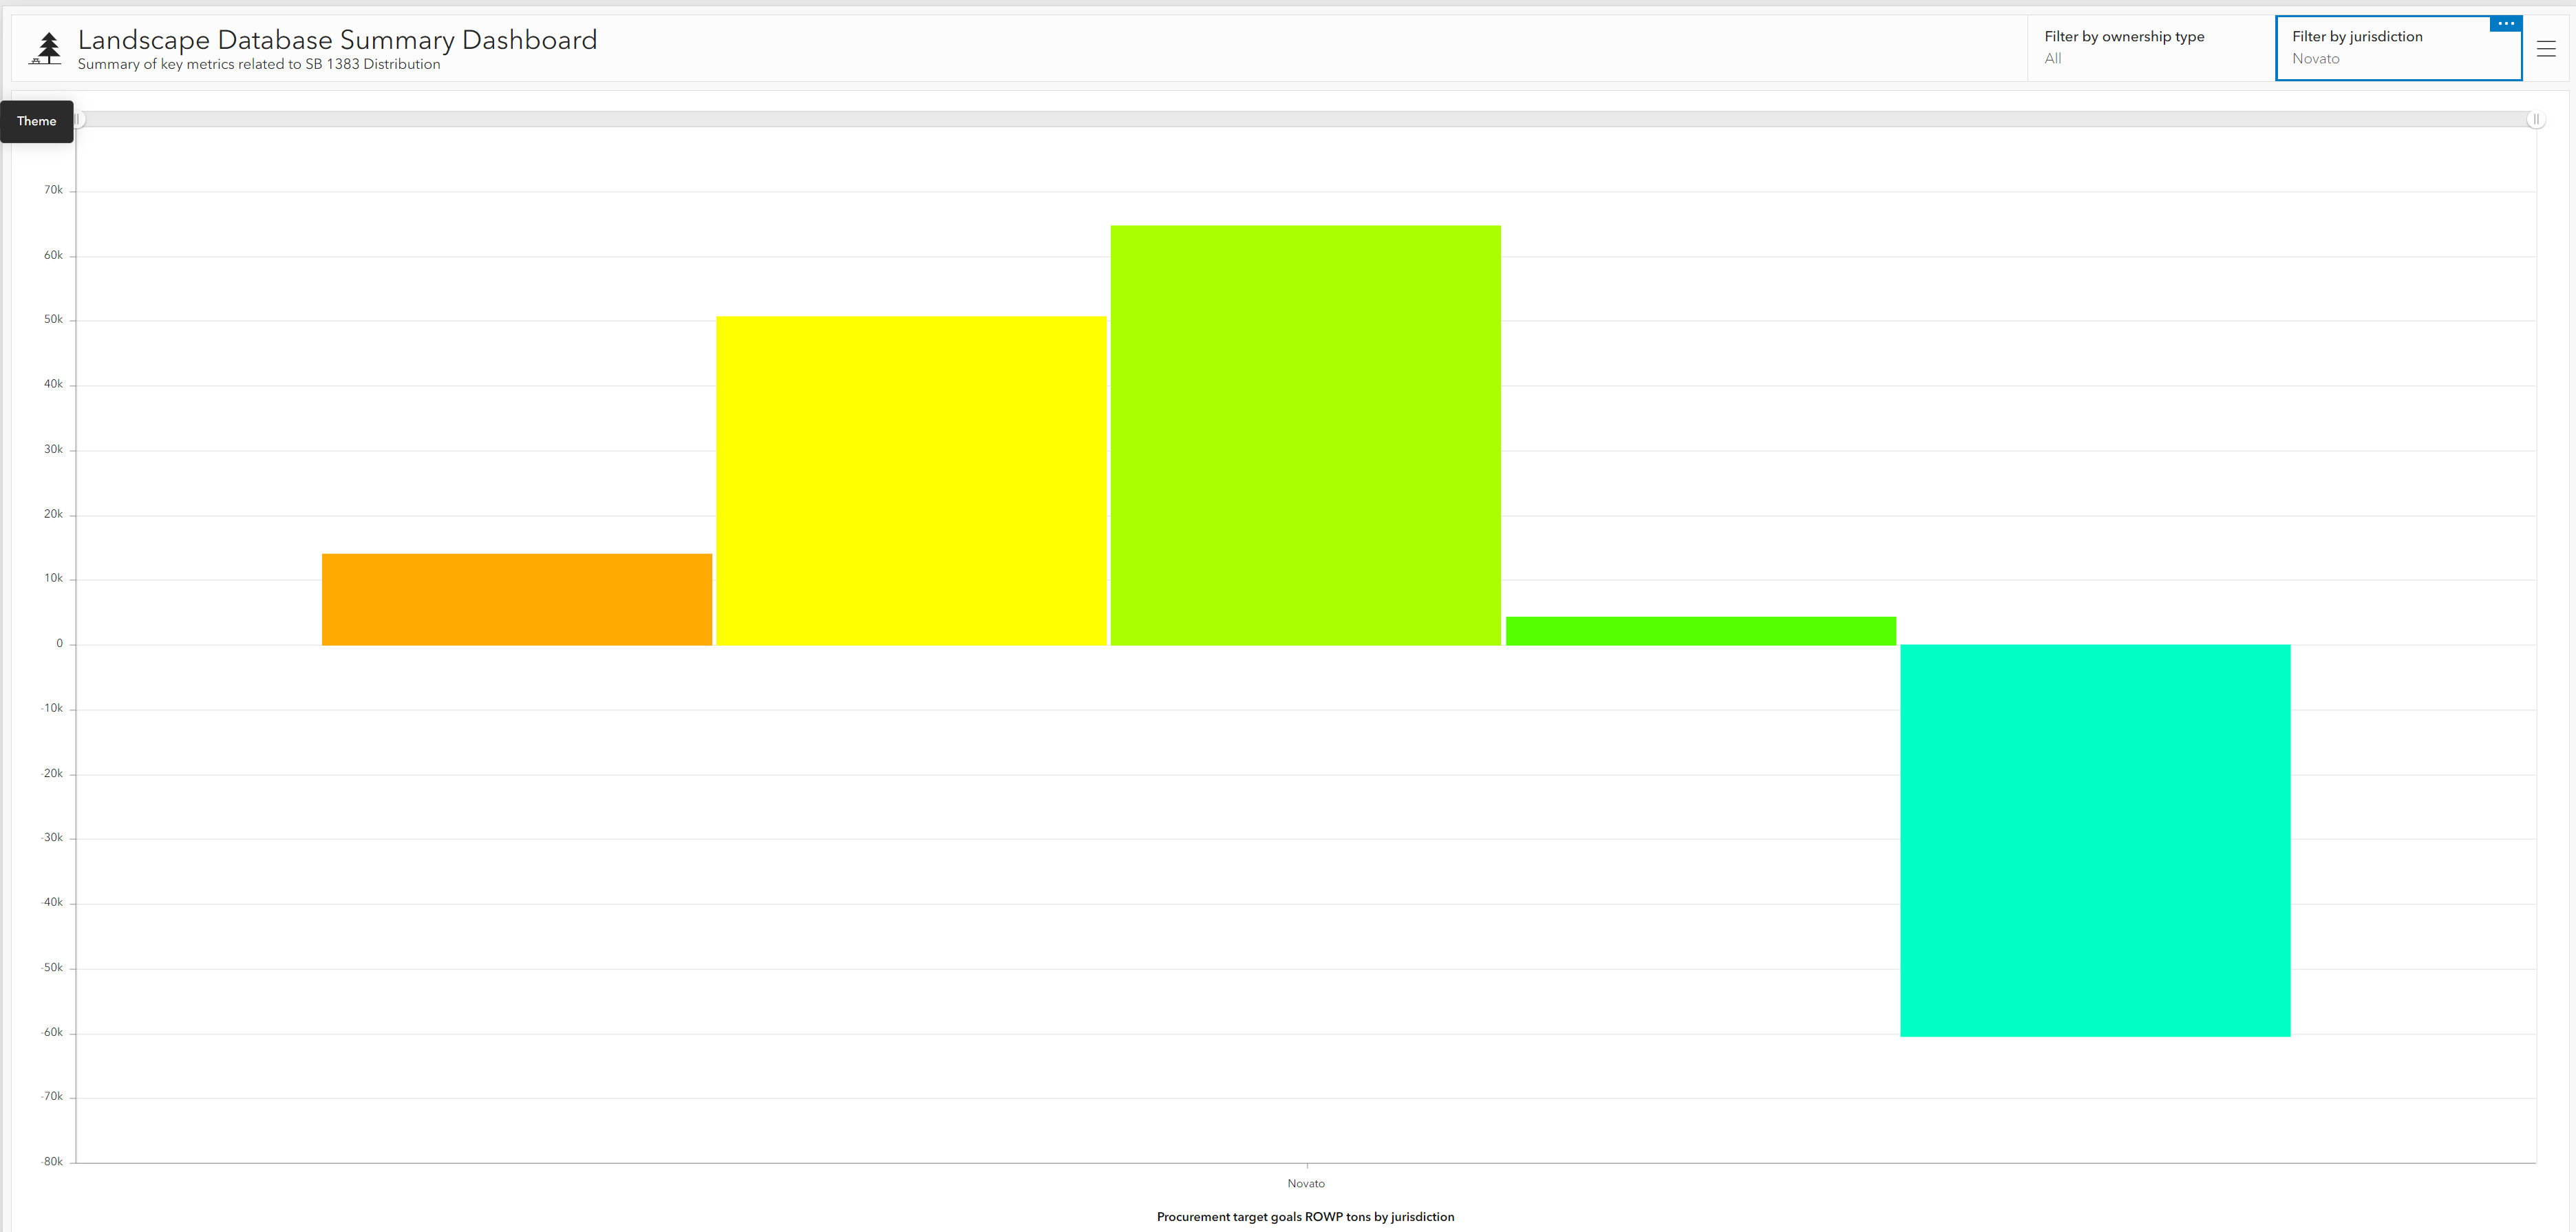
We also have an additional filter by Agency Ownership Level (string). We'd like to create a nested serial chart (if possible) where we can filter by jurisdiction and/or agency ownership level. How could I do this with my current data expression below. The text string attribute for Agency Ownership Level is 'AGNCY_LEV'. We were successful in creating a Serial Chart with GroupBy 'Jurisdiction'. Is it possible to have a nested serial chart with two string filters (two separate columns). For example, if we filter by Novato, can we then filter by City agency level to show what those numbers are in the same serial chart?
Source code below:
// Write an expression that returns a FeatureSet.
// Documentation: https://arcg.is/3c419TD
// Samples: https://arcg.is/38SEWWz


var portal = Portal("https://marincounty.maps.arcgis.com/");
var polyFs = FeatureSetByPortalItem(portal,"1112f6fa268c48948093050fe0fc0c44",0,["*"],true);

var tablefs = FeatureSetByPortalItem(portal, "1093d97dbe43474b96d09b701d9672a1", 1,["Jurisdiction","Population","ProcurementTarget","uniqueID"],false);
// return(tablefs)


// create grouped table variable
var polyGroup = GroupBy(polyFs,
['Jurisdiction'],
[{name:'SumPotentialCompTons', expression: "PotentialCompTons", statistic: 'SUM'},
{name:'SumPotentialMulchTons', expression: "PotentialMulchTons", statistic: 'SUM'},
{name:'SumPotentialROWPTons', expression: "TotPotentialROWPTons", statistic: 'SUM'}]);


// create empty features
var features = [];
var feat;

// populate feature array
for (var t in tablefs){
  var tableID = t["Jurisdiction"]
  for (var p in Filter(polyGroup, "Jurisdiction = @tableID")){
    feat = {
      attributes: {
        FeatureID: tableID,
        Name: p["Jurisdiction"],
        PotCompTons: p["SumPotentialCompTons"],
        PotMulchTons: p["SumPotentialMulchTons"],
        PotROWPTons: p["SumPotentialROWPTons"],
        Population: t["Population"],
        ProcurementTarget: t["ProcurementTarget"],
        TargetRemaining: Round((t["ProcurementTarget"] - p["SumPotentialROWPTons"]),2),

      }
    }
  Push(features,feat)
  }
}

var joinedDict = {
  fields: [
    { name: "FeatureID", type: "esriFieldTypeInteger" },
    { name: "Name", type: "esriFieldTypeString" },
    { name: "PotCompTons", type: "esriFieldTypeDouble" },
    { name: "PotMulchTons", type: "esriFieldTypeDouble" },
    { name: "PotROWPTons", type: "esriFieldTypeDouble" },
    { name: "Population", type: "esriFieldTypeInteger" },
    { name: "ProcurementTarget", type: "esriFieldTypeDouble" },
    { name: "TargetRemaining", type: "esriFieldTypeDouble" },
  ],
  'geometryType': '',
  'features':features
};

// return dict as feature set
return FeatureSet(joinedDict);
Thanks for any help! Let me know if you need any clarifications or additional information

