Hello,
I am working on a dashboard of police call data, and I'm trying to keep the data in separate layers for each fiscal year's worth of data. I had been doing one layer with multiple years and after 5 + years the table has over 150,000 records and it's gotten a bit unwieldy. So right now I'm working with just two years of data. I have a simple serial chart showing number of calls by sector in that year, but I'd like to have a chart that combines both years' calls to compare year to year.
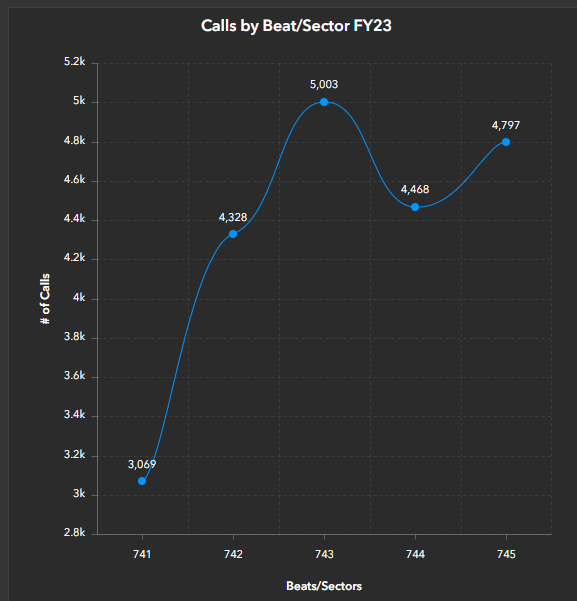
In addition, I have indicators for all 5 sectors just showing the total number of calls in each sector. I thought it would be cool to be able to filter each indicator with the top call type in each sector automatically, so as we add calls data each month, the indicators would automatically update with the current top call type. I can always post that question separately. But I figured I'd just include it here for now.
My problem is I've never learned arcade beyond the basic calculate scripts because I've just never been good at learning coding. It never makes sense to me. So I'm hoping someone can point me in the right direction.
Thanks!
Matt