Hello I am trying to create a dashboard with Pie chart ad Stacked bar chart. I am using Internet Explorer 8 (official Internet browser of the company). When the rendering happens, I get random results. Please see below:
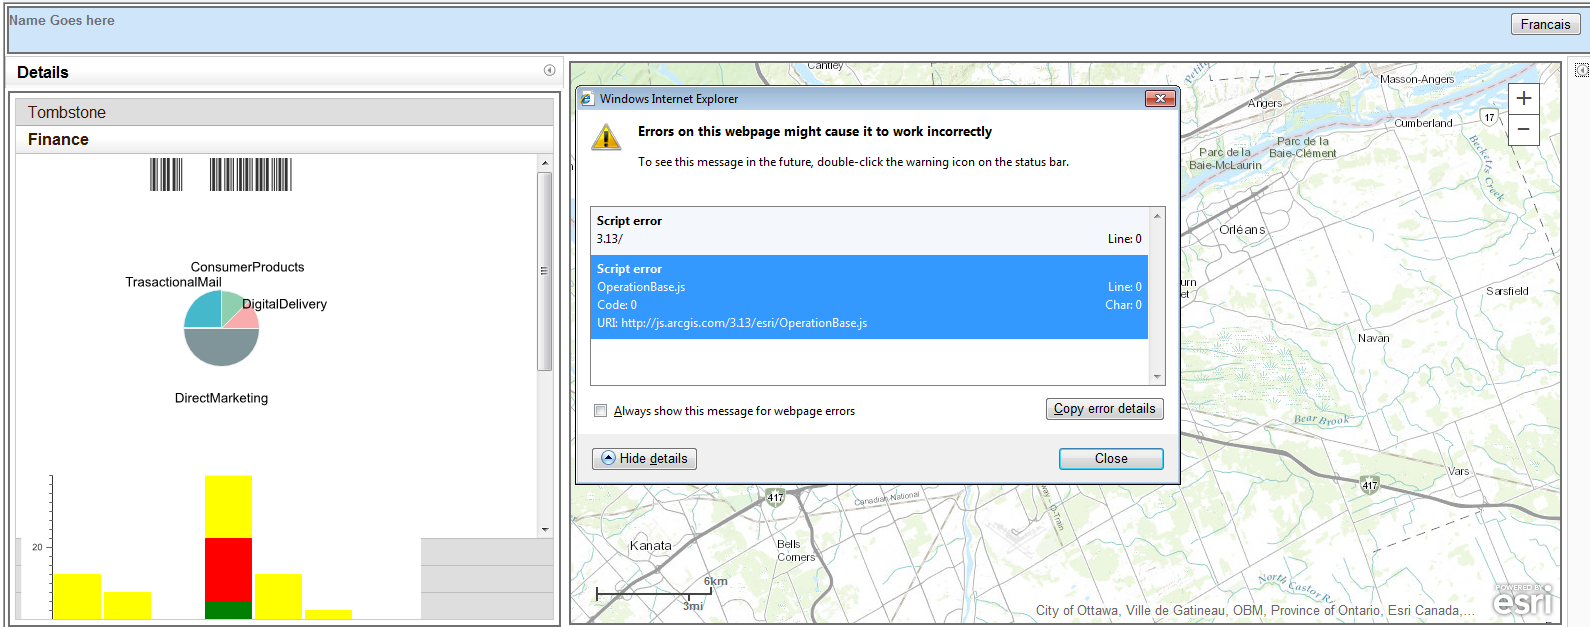
size of the bar chart and font are not at all consistent .
It should be a CSS problem because when I use Chrome or Firefox I get normal charts.
This is a small piece of my code
<!DOCTYPE html PUBLIC "-//W3C//DTD HTML 4.01 Transitional//EN" "http://www.w3.org/TR/html4/loose.dtd">
<html>
  <head>
    <meta http-equiv="Content-Type" content="text/html; charset=utf-8">
    <meta name="viewport" content="initial-scale=1, maximum-scale=1,user-scalable=no">

    <link rel="stylesheet" href="http://js.arcgis.com/3.13/dijit/themes/soria/soria.css">
  <link rel="stylesheet" href="http://js.arcgis.com/3.13/dojox/layout/resources/ExpandoPane.css">
    <link rel="stylesheet" href="http://js.arcgis.com/3.13/esri/css/esri.css">


    <link rel="stylesheet" href="CSS/newPortal.css">
    <script src="http://js.arcgis.com/3.13/"></script>

  </head>
  <script>
require(["dojox/charting/Chart", "dojox/charting/plot2d/Pie", "dojox/charting/action2d/Highlight",
         "dojox/charting/action2d/MoveSlice" , "dojox/charting/action2d/Tooltip",
         "dojox/charting/themes/MiamiNice", "dojox/charting/widget/Legend",   "dojox/charting/axis2d/Default",  "dojox/charting/plot2d/StackedColumns",    "dojox/charting/action2d/Magnify", "dojox/charting/widget/SelectableLegend", "dojo/ready"],
  function(Chart, Pie, Highlight, MoveSlice, Tooltip, MiamiNice, Legend,  Default, StackedColumns, Magnify, SelectableLegend,ready){

    var pieChart = new Chart("pieChart");
  pieChart.title = "BW Sales";
    pieChart.setTheme(MiamiNice)
     .addPlot("default", {
        type: Pie,
        font: "normal normal 11pt Tahoma",
        fontColor: "black",
        labelOffset: -30,
        radius: 80
    }).addSeries("Series A", [
        {y: 4, text: "Red",   stroke: "#9fbf7f", tooltip: "Red is 50%"},
        {y: 2, text: "Green", stroke: "#9fbf7f", tooltip: "Green is 25%"},
        {y: 1, text: "Blue",  stroke: "#287acc", tooltip: "I am feeling Blue!"},
        {y: 1, text: "Other", stroke: "287acc", tooltip: "Mighty <strong>strong</strong><br>With two lines!"}
    ]);
    var anim_a = new MoveSlice(pieChart, "default");
    var anim_b = new Highlight(pieChart, "default");
    var anim_c = new Tooltip(pieChart, "default");
    pieChart.render();
    var legendTwo = new Legend({chart: pieChart}, "legendTwo");
  /*
  */


     var barChart = new dojox.charting.Chart("barChart");
      barChart.addPlot("default",{type: "StackedColumns", gap: 2});
      barChart.addAxis("x");
      barChart.addAxis("y", {vertical: true, includeZero: true});
      barChart.addSeries("A", [2,3,5,7,2,4,6], {plot: "default", fill: "blue", stroke: {color: "blue"}});
      barChart.addSeries("C", [5,4,2,7,5,3,1], {plot: "default", fill: "green", stroke: {color: "green"}});
      barChart.addSeries("D", [5,4,2,7,5,3,1], {plot: "default", fill: "red", stroke: {color: "red"}});
      barChart.addSeries("E", [5,4,2,7,5,3,1], {plot: "default", fill: "yellow", stroke: {color: "yellow"}});


      var tooltip = new Tooltip( barChart, "default", {
        text : function(point) {
          console.debug(point);
          return "This is " + point.y;
        }
      });


      barChart.render();
      var clusteredColumnsLegend = new SelectableLegend({chart: barChart}, "barChartLegend");

    });


  </script>
</head>
<body class="claro">
 <div id="pieChart" style="width: 300px; height: 300px;"></div>
<div id="legendTwo"></div>
<div data-dojo-type="dojox.charting.widget.Chart" id="barChart" style="width: 350px; height: 200px;">


</div>
    <br/>
<div id="barChartLegend"></div>
</body>
</html>Would it be possible to know what is the problem? How to resolve it?
I have another questions: is there another way to create charts?
Thanks
Abel



