Hi! I'm very new to creating 3D images with ArcGIS Pro, so bear with me please!
I have some geophysical data collected along a straight line on the surface. I want to add this to my scene in ArcGIS Pro to create a sort of cross section of the subsurface. I want to know how I should structure the data in a .grd file (or other file format that I can write in MATLAB) in order to have the correct effect. If I represent the data as a grid, each column would have a different [x,y] coordinate, and each row would have a different z coordinate. I believe when writing a 2D .grd file for [x,y] viewing only, I would simply indicate the x- and y-coordinate of the first corner, as well as a standard cell size, which would be the same in both directions.
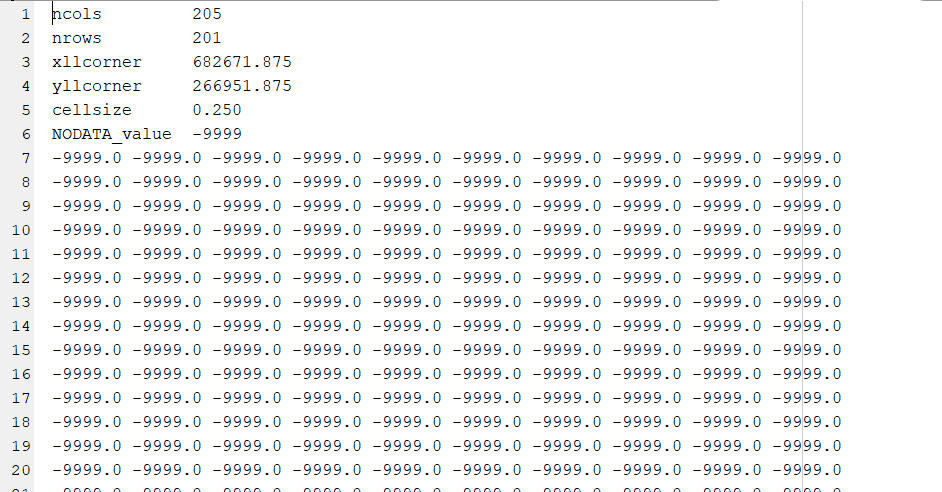
How would this be structured in 3 dimensions? Or is there a better way to do it?
Hopefully this makes sense, otherwise let me know. Thanks you advance!


