Hi,
I'm just starting out using the Darcy Flow Analysis tool in the Spatial Analyst toolbox. I was just testing it with some data sets that should be reasonable for my study area. The first time I ran it, I got a smooth looking raster with some high residuals.
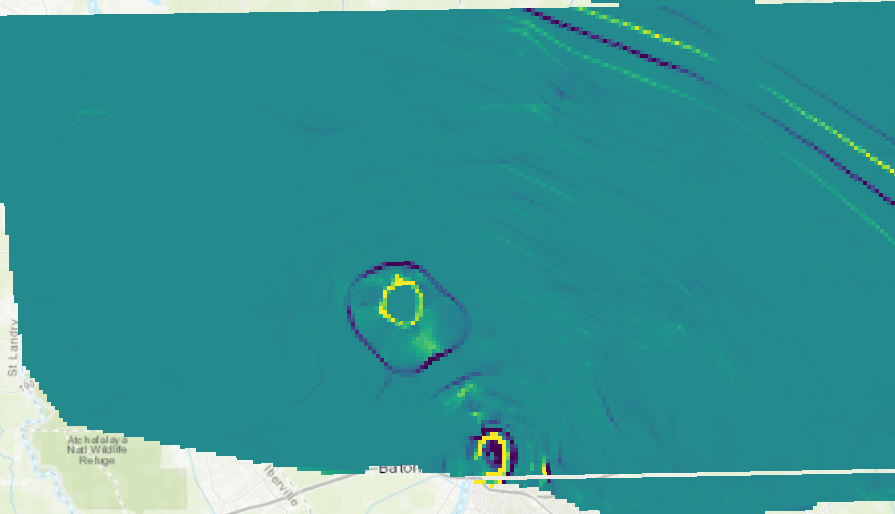
I realized that my potentiometric surface was in the WGS84 coordinate system while the rest of my data was in UTM15N. I re-projected my potentiometric surface to UTM15N and ran the Darcy Flow analysis again. This time the residuals show lots of square edges.
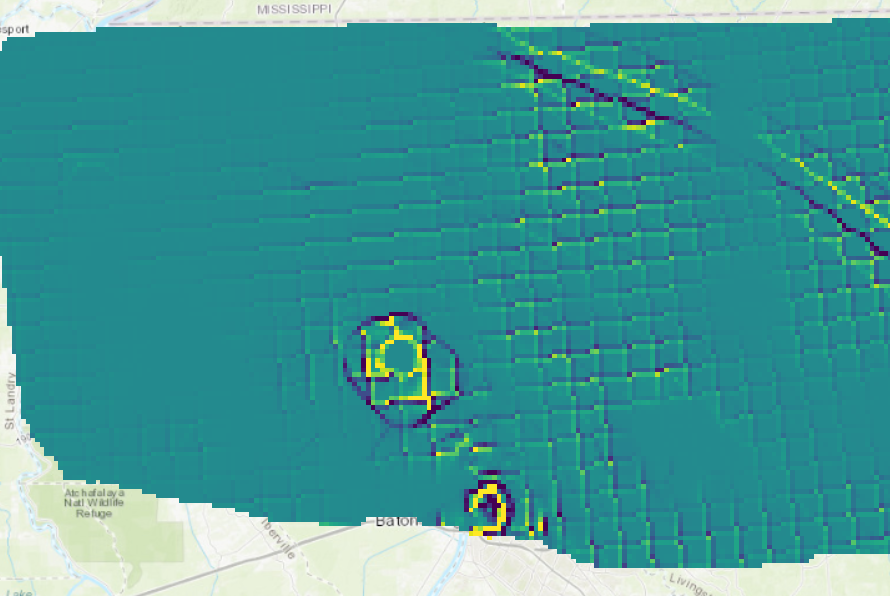
It seems very odd that matching the coordinate systems would make the results look worse.
I'm not sure if there is an issue with using UTM or if there is a problem with the input data sets that only shows up when I match the coordinate systems. Or if there is something else going on.
Any ideas??
Thanks,
Diana