I am building a multiple series vertical bar graph with arcpy.Graph in ArcMap 10.6.1. The short version is:
<SPAN class="keyword token">import</SPAN> arcpy
TESTDIR <SPAN class="operator token">=</SPAN> <SPAN class="operator token"><</SPAN>some dir<SPAN class="operator token">></SPAN>
arcpy<SPAN class="punctuation token">.</SPAN>env<SPAN class="punctuation token">.</SPAN>workspace <SPAN class="operator token">=</SPAN> TESTDIR
arcpy<SPAN class="punctuation token">.</SPAN>env<SPAN class="punctuation token">.</SPAN>scratchWorkspace <SPAN class="operator token">=</SPAN> TESTDIR
arcpy<SPAN class="punctuation token">.</SPAN>env<SPAN class="punctuation token">.</SPAN>overwriteOutput <SPAN class="operator token">=</SPAN> <SPAN class="token boolean">True</SPAN>
arcpy<SPAN class="punctuation token">.</SPAN>env<SPAN class="punctuation token">.</SPAN>qualifiedFieldNames <SPAN class="operator token">=</SPAN> <SPAN class="token boolean">False</SPAN>
outGraphName <SPAN class="operator token">=</SPAN> <SPAN class="string token">"VerticalBarGraph"</SPAN>
outGraphJpeg <SPAN class="operator token">=</SPAN> <SPAN class="string token">"VerticalBarGraph.jpg"</SPAN>
inputTemplate <SPAN class="operator token">=</SPAN> <SPAN class="string token">"SeriesComparison1.grf"</SPAN>
graph <SPAN class="operator token">=</SPAN> arcpy<SPAN class="punctuation token">.</SPAN>Graph<SPAN class="punctuation token">(</SPAN><SPAN class="punctuation token">)</SPAN>
inFieldNames <SPAN class="operator token">=</SPAN> <SPAN class="punctuation token">[</SPAN>f<SPAN class="punctuation token">.</SPAN>name <SPAN class="keyword token">for</SPAN> f <SPAN class="keyword token">in</SPAN> arcpy<SPAN class="punctuation token">.</SPAN>ListFields<SPAN class="punctuation token">(</SPAN><SPAN class="string token">"OUT.dbf"</SPAN><SPAN class="punctuation token">)</SPAN> <SPAN class="keyword token">if</SPAN> f<SPAN class="punctuation token">.</SPAN>name <SPAN class="operator token">!=</SPAN> <SPAN class="string token">'OID'</SPAN><SPAN class="punctuation token">]</SPAN>
<SPAN class="keyword token">for</SPAN> i <SPAN class="keyword token">in</SPAN> range<SPAN class="punctuation token">(</SPAN><SPAN class="number token">1</SPAN><SPAN class="punctuation token">,</SPAN> len<SPAN class="punctuation token">(</SPAN>inFieldNames<SPAN class="punctuation token">)</SPAN><SPAN class="punctuation token">)</SPAN><SPAN class="punctuation token">:</SPAN>
graph<SPAN class="punctuation token">.</SPAN>addSeriesBarVertical<SPAN class="punctuation token">(</SPAN><SPAN class="string token">"OUT.dbf"</SPAN><SPAN class="punctuation token">,</SPAN> inFieldNames<SPAN class="punctuation token">[</SPAN>i<SPAN class="punctuation token">]</SPAN><SPAN class="punctuation token">,</SPAN> <SPAN class="string token">"LABEL"</SPAN><SPAN class="punctuation token">)</SPAN>
arcpy<SPAN class="punctuation token">.</SPAN>MakeGraph_management<SPAN class="punctuation token">(</SPAN>inputTemplate<SPAN class="punctuation token">,</SPAN> graph<SPAN class="punctuation token">,</SPAN> outGraphName<SPAN class="punctuation token">)</SPAN>
arcpy<SPAN class="punctuation token">.</SPAN>SaveGraph_management<SPAN class="punctuation token">(</SPAN>outGraphName<SPAN class="punctuation token">,</SPAN> outGraphJpeg<SPAN class="punctuation token">,</SPAN> <SPAN class="string token">"MAINTAIN_ASPECT_RATIO"</SPAN><SPAN class="punctuation token">,</SPAN> <SPAN class="number token">1000</SPAN><SPAN class="punctuation token">)</SPAN><SPAN class="line-numbers-rows"><SPAN></SPAN><SPAN></SPAN><SPAN></SPAN><SPAN></SPAN><SPAN></SPAN><SPAN></SPAN><SPAN></SPAN><SPAN></SPAN><SPAN></SPAN><SPAN></SPAN><SPAN></SPAN><SPAN></SPAN><SPAN></SPAN><SPAN></SPAN><SPAN></SPAN></SPAN>The output is just what I am after except that for three input fields it produces a legend with entries:
Vertical Bar
Vertical Bar 2
Vertical Bar 3
These can be changed interactively in ArcMap (see below) and I have done this to generate the template graph. I want to use Python to change these defaults, depending on user input, to the names of the input fields but I have had no success. I have been reduced to trying to reverse engineer what's going on in the interactive view:
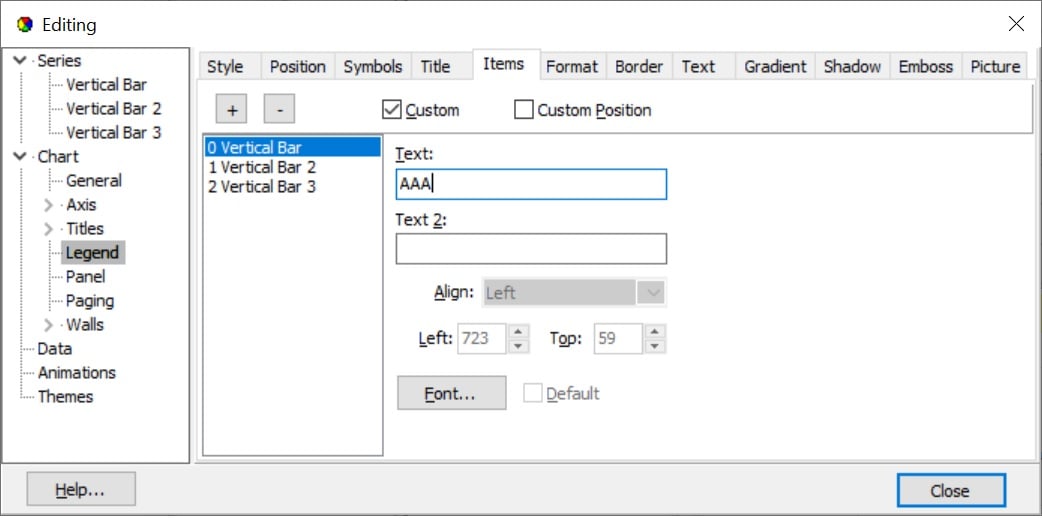
by adding a couple of lines to the for loop above:
<SPAN class="keyword token">for</SPAN> i <SPAN class="keyword token">in</SPAN> range<SPAN class="punctuation token">(</SPAN><SPAN class="number token">1</SPAN><SPAN class="punctuation token">,</SPAN> len<SPAN class="punctuation token">(</SPAN>inFieldNames<SPAN class="punctuation token">)</SPAN><SPAN class="punctuation token">)</SPAN><SPAN class="punctuation token">:</SPAN>
graph<SPAN class="punctuation token">.</SPAN>addSeriesBarVertical<SPAN class="punctuation token">(</SPAN><SPAN class="string token">"OUT.dbf"</SPAN><SPAN class="punctuation token">,</SPAN> inFieldNames<SPAN class="punctuation token">[</SPAN>i<SPAN class="punctuation token">]</SPAN><SPAN class="punctuation token">,</SPAN> <SPAN class="string token">"LABEL"</SPAN><SPAN class="punctuation token">)</SPAN>
graph<SPAN class="punctuation token">.</SPAN>graphSeries<SPAN class="punctuation token">[</SPAN>i <SPAN class="operator token">-</SPAN> <SPAN class="number token">1</SPAN><SPAN class="punctuation token">]</SPAN><SPAN class="punctuation token">.</SPAN>Custom <SPAN class="operator token">=</SPAN> <SPAN class="token boolean">True</SPAN>
graph<SPAN class="punctuation token">.</SPAN>graphSeries<SPAN class="punctuation token">[</SPAN>i <SPAN class="operator token">-</SPAN> <SPAN class="number token">1</SPAN><SPAN class="punctuation token">]</SPAN><SPAN class="punctuation token">.</SPAN>Text <SPAN class="operator token">=</SPAN> inFieldNames<SPAN class="punctuation token">[</SPAN>i<SPAN class="punctuation token">]</SPAN><SPAN class="line-numbers-rows"><SPAN></SPAN><SPAN></SPAN><SPAN></SPAN><SPAN></SPAN></SPAN>These instructions are accepted and I can print out their values but they have no effect on the graph output.
Is what I am trying to do possible with arcpy? Perhaps I am looking in the wrong place. I would be grateful for any advice.
Ian
