- Home
- :
- All Communities
- :
- Industries
- :
- Education
- :
- Education Blog
- :
- New Workshop and Lesson on Connecting Surveys, Map...
New Workshop and Lesson on Connecting Surveys, Maps, Analysis, Dashboards, and Story Maps
- Subscribe to RSS Feed
- Mark as New
- Mark as Read
- Bookmark
- Subscribe
- Printer Friendly Page
- Report Inappropriate Content
Connecting components of modern GIS, including field surveys, dashboards, interactive maps, spatial analysis, and multimedia web mapping applications such as dashboards and story maps help organizations understand key local issues and situations and take action.
Lessons: This set of 8 lessons (linked here as a 22 MB zip file containing lesson and all images and graphics needed) (a PDF lesson without the image files is attached to this post; a PDF of a short set of introductory slides is also attached) guides you through the entire process from the creation of a field survey in ArcGIS Survey123, mapping the resulting data in ArcGIS Online, analyzing the data, creating and using an ArcGIS Dashboard, to the process of creating an ArcGIS StoryMap. It does so through 8 lesson components: 4 introductory lessons, followed by 4 "deeper dive" lessons that are on an intermediate skill level. Step-by-step instructions are included, but even more importantly, deeper thinking is encouraged about the insights gained through these tools.
Themes: Three key themes run through these lessons and provide the major teaching and learning objectives: (1) Modern web GIS is a platform. When the components are linked together, these provide for powerful tools for data gathering, mapping, analysis, and communication. (2) Modern GIS platform components are approachable, able to be learned in a short amount of time, and configurable. In this case, the components used are: ArcGIS Story Maps, ArcGIS Online maps including visualization and analysis capabilities, ArcGIS Dashboards, and ArcGIS Story Maps. (3) Once key skills are learned, they can be built on for extended learning (hence the 4 'deeper dives' lessons included here).
Users: These sets of lessons can be used by the GIS professional community in nonprofit organizations, government agencies, and private industry, and also by instructors at the upper secondary but especially in community, tribal, and technical college and university courses to foster spatial thinking, critical thinking, and rigorous development of GIS skills, using up-to-date GIS tools and spatial data. In education, these lessons could be used in GIS courses and programs, but also in environmental or earth science, hydrology, cultural or physical geography, architecture, history, sociology, economics, or any course in which the "where" question matters and in which fieldwork is important.
Example and Extensions: This lesson focuses on walkability, and walkable neighborhoods: How walkable is a neighborhood? Collect walkability information in a neighborhood: Is it walkable? How walkable (rating) is it? What characteristics of the site impact its walkability? Where is the site located, and do you have a photograph of it? How does walkability vary in my community and how does it compare to other communities? How can I visualize and spatially analyze the patterns of walkability with maps and dashboards? How can I communicate the economic, social, health, and aesthetic reasons why communities care about walkability, the results of my walkability survey, and a call to action in a StoryMap?
Despite the focus on walkability here, the same concepts in these lessons can be used for any theme or subject, from local to global—pedestrian and vehicle counts, water quality, weather observations, housing or business type, zoning, light poles, recycling bins, invasive species, litter, and other features or issues in the natural or built landscape. After these lessons are used, the learner can dig even deeper with the links I provide in the lesson, and with more powerful expressions using Arcade, the ArcGIS Experience Builder, and with the ArcGIS Developer Tools, SDKs, and APIs.
Evaluation: I have successfully tested this set of lessons in a wide variety of settings from the GIS professional community to students in university GIS courses over a series of years, and in multiple countries of the world.
Prerequisites and Scaffolding: The introductory lessons require no prior experience beyond the basics of understanding what a web map is, what a GIS layer is, how attributes and geography work together, and about the basic navigation of ArcGIS Online maps and user content. The intermediate lessons build on the introductory lessons or equivalent experience, and immerse the learner into such tasks as map actions, building Arcade expressions, doing spatial analysis including clustering and hot spots analysis, using generative AI to build field surveys, and creating Map Tour and Express Map components in StoryMaps.
Functions included: Survey123: Likert scale, single and multiple choice questions, maps, images, generative AI surveys. ArcGIS Online Map Viewer: symbolization (styling), classification, basemaps, transparency, create charts, clustering, hot spot, filtering, custom symbols, popups, and other analysis tools. Dashboards: Indicators, maps, bar graphs, pie charts, Arcade expressions, legends, images. StoryMaps: Map tours, popups, text, images, separators, themes, settings, videos, and more.
Requirements:
Time: I have run the first 4 lessons of this workshop in demonstration mode in as little as one hour. If you read these first 4 lessons (pages 1-20 of the 43 pages of content available) in an hour, you will gain some key skills. But as is the case with so much in the world of GIS, working through the activities yourself is the best way to learn. Plan on 2 to 4 hours to work through the first 4 lessons, and 4 hours to work through Lessons 5-8. Add more time if you are not familiar with using GIS or Web GIS, and subtract time if you are a regular ArcGIS Online user.
Hardware: You can run these lessons on a large tablet or a laptop computer. A small laptop or phone will not give you enough 'real estate' screen space to operate all the buttons in the various tools.
Software: (1) An ArcGIS Online account in which you have the User Type of Creator and the Role of Publisher. (2) The 21.5 MB zip file associated with this lesson, located here, which contains all necessary components: Selected field photographs, custom point graphics, and this lesson in PDF and in DOCX formats (DOCX is included so that you will be able to easily modify the lesson if you wish). No software is required beyond a web browser as you will be running ArcGIS Online which is a SaaS Software as a Service, in the cloud. An internet connection is critical.
Organization: This lesson set is organized in 8 parts:
Introduction:
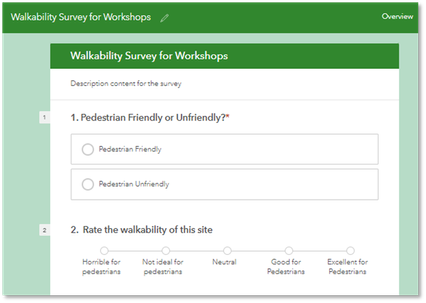
Part 1: Creating a field survey using ArcGIS Survey123.
Part 2: Creating and analyzing a map from your survey data.
Part 3: Creating an ArcGIS Dashboard from your survey data.
Part 4: Creating an ArcGIS StoryMap from your field data.
Deeper Dive:
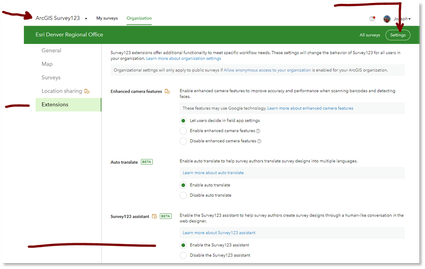
Part 5: Creating a field survey using the Survey123 AI Artificial Intelligence Assistant, plus branching.
Part 6: Perform spatial analysis on your mapped data.
Part 7: Adding intermediate elements to your ArcGIS Dashboard.
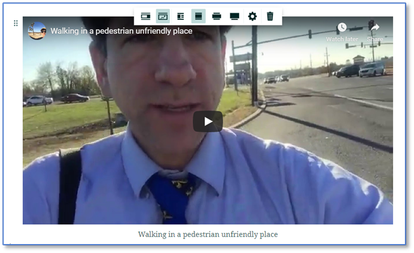
Part 8: Adding intermediate elements to your ArcGIS StoryMap.
Selected graphics from the set of lessons are below so that you will get a feel for the contents.
I look forward to hearing your reactions!
Creating a map action for the dashboard.
Creating a modified list using Arcade scripting on the dashboard.
Creating a story map with the survey data.
Creating a mobile version of the dashboard.
Performing clustering and spatial analysis on the surveyed data.
Using generative AI to create a field survey.
Creating a hot spot analysis on the surveyed data.
Creating a field survey.
Symbolizing the mapped data.
Creating a dashboard from the field survey.
Adding a video to the story map.
Testing survey results on the web map.
You must be a registered user to add a comment. If you've already registered, sign in. Otherwise, register and sign in.
-
Administration
41 -
Announcements
49 -
Career & Tech Ed
1 -
Curriculum-Learning Resources
189 -
Education Facilities
24 -
Events
49 -
GeoInquiries
1 -
Higher Education
526 -
Informal Education
266 -
Licensing Best Practices
49 -
National Geographic MapMaker
18 -
Pedagogy and Education Theory
192 -
Schools (K - 12)
282 -
Schools (K-12)
191 -
Spatial data
24 -
STEM
3 -
Students - Higher Education
232 -
Students - K-12 Schools
90 -
Success Stories
22 -
TeacherDesk
1 -
Tech Tips
84
- « Previous
- Next »


