-
All Communities
ProductsIndustriesDevelopersGlobal
- ArcGIS Ideas
- GIS Life
- Community Resources
Turn on suggestions
Auto-suggest helps you quickly narrow down your search results by suggesting possible matches as you type.
Cancel
Cartography and Maps Blog
Turn on suggestions
Auto-suggest helps you quickly narrow down your search results by suggesting possible matches as you type.
- Home
- :
- All Communities
- :
- User Groups
- :
- Cartography and Maps
- :
- Blog
Options
- Mark all as New
- Mark all as Read
- Float this item to the top
- Subscribe to This Board
- Bookmark
- Subscribe to RSS Feed
Subscribe to This Board
Latest Activity
(4 Posts)
Esri Contributor
09-02-2016
11:12 AM
2
0
376

39 Subscribers
Popular Articles
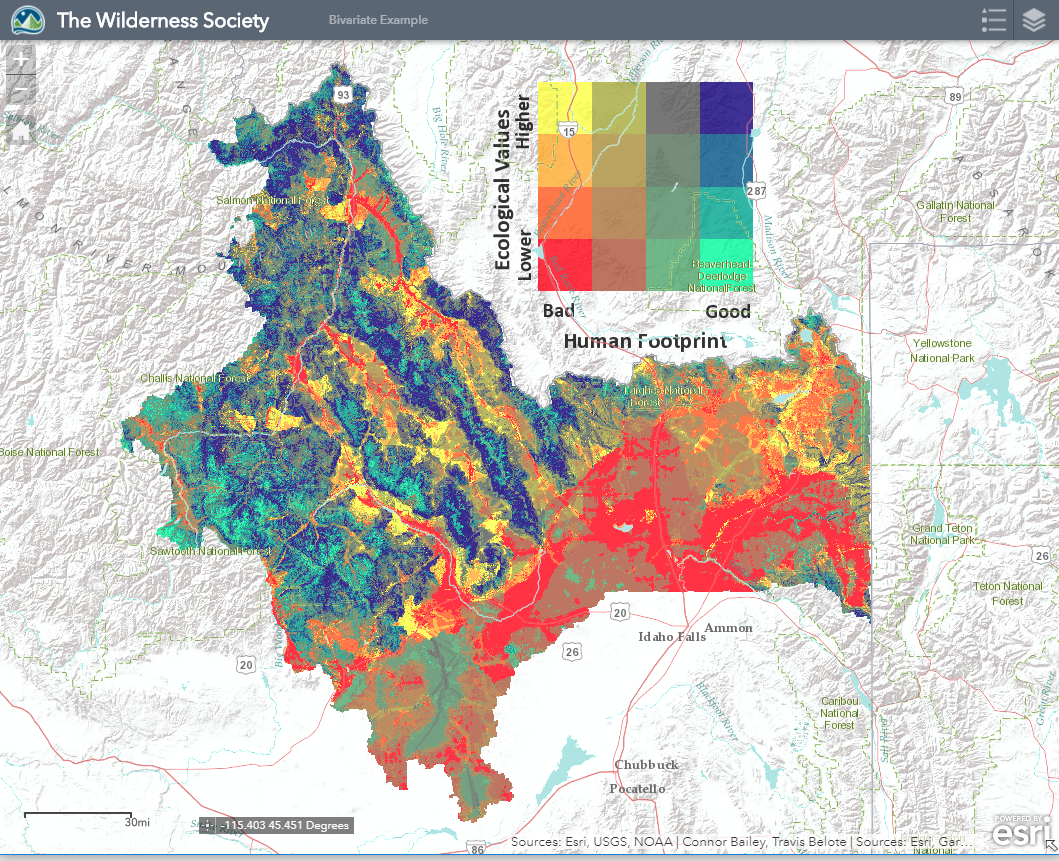
Bivariate Mapping
Phil_Hartger
Regular Contributor
4 Kudos
2 Comments
Here it comes! Map Use, 8th Edition!
AileenBuckley
Esri Contributor
2 Kudos
0 Comments
Canton Graubünden Publish New Basisplan
MarkWigley
Esri Alum
0 Kudos
1 Comments