Turn on suggestions
Auto-suggest helps you quickly narrow down your search results by suggesting possible matches as you type.
Cancel
- Home
- :
- All Communities
- :
- Products
- :
- ArcGIS Dashboards
- :
- ArcGIS Dashboards Questions
- :
- operations dashboard serial chart label percentage...
Options
- Subscribe to RSS Feed
- Mark Topic as New
- Mark Topic as Read
- Float this Topic for Current User
- Bookmark
- Subscribe
- Mute
- Printer Friendly Page
operations dashboard serial chart label percentages of categories instead of count. I know pie chart gives %, but I need a bar chart.
Subscribe
1660
4
07-12-2019 09:01 AM
07-12-2019
09:01 AM
- Mark as New
- Bookmark
- Subscribe
- Mute
- Subscribe to RSS Feed
- Permalink
- Report Inappropriate Content
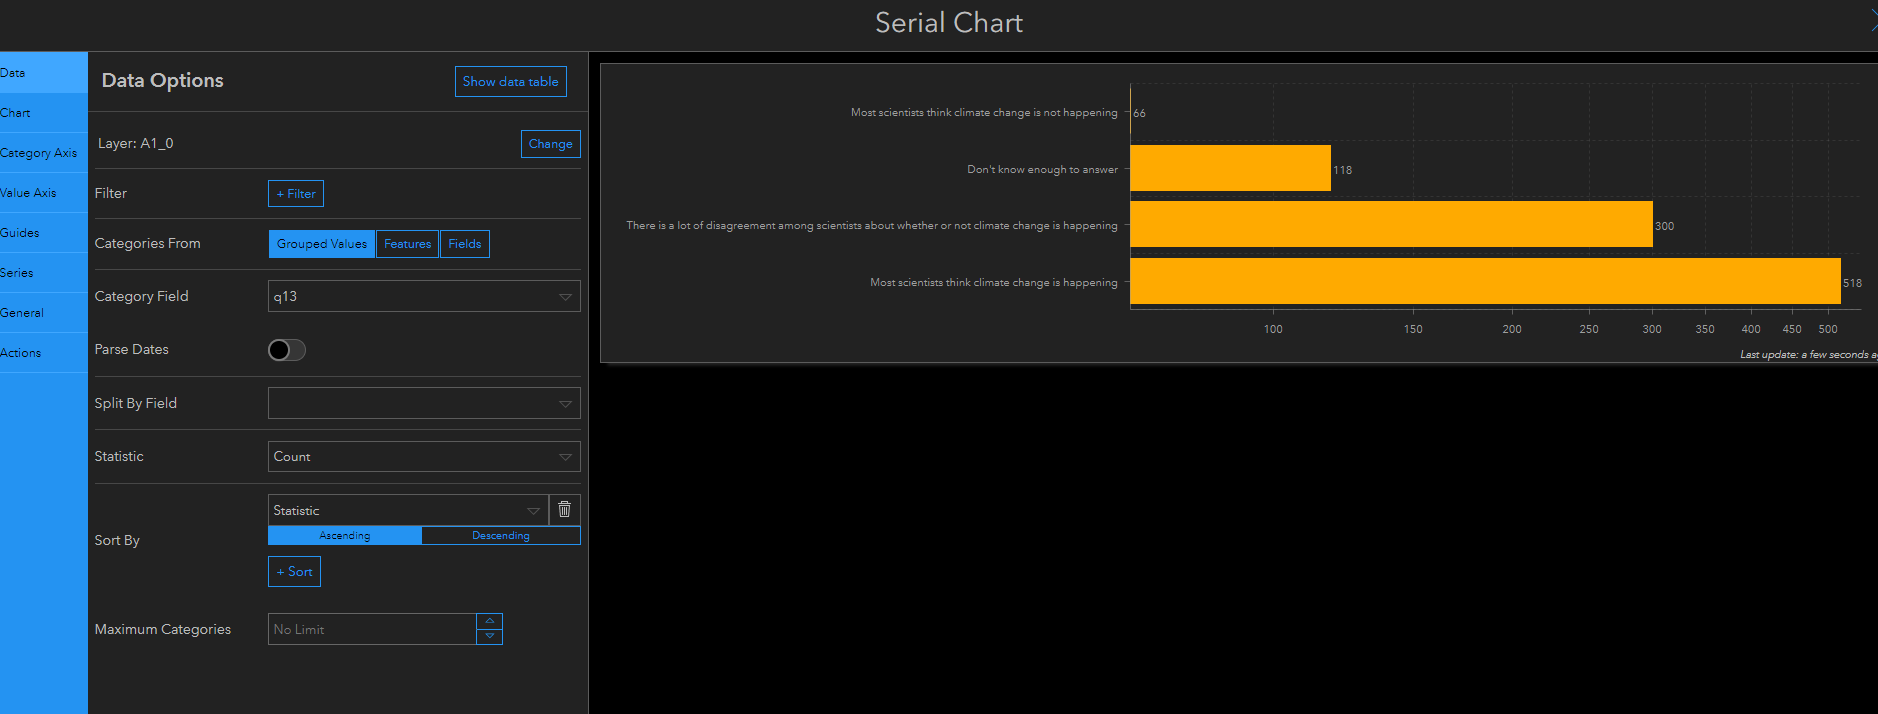
On data options (screenshot included) set to grouped values and the "Statistic" option has count, average, mean etc. but not percentage as an option. It seems like labeling bar graphs with percentages should be an option but I cant find any documentation on how to make it happen.
Anyone know how the image below would label the percentage of bar total instead of count?
Thanks in advance.
4 Replies
10-10-2019
03:42 PM
- Mark as New
- Bookmark
- Subscribe
- Mute
- Subscribe to RSS Feed
- Permalink
- Report Inappropriate Content
Is there any news about this topic? I also have the same question as the original poster.
Thanks!
Allen
05-19-2020
12:16 PM
- Mark as New
- Bookmark
- Subscribe
- Mute
- Subscribe to RSS Feed
- Permalink
- Report Inappropriate Content
Also have the same question?
02-22-2021
05:25 AM
- Mark as New
- Bookmark
- Subscribe
- Mute
- Subscribe to RSS Feed
- Permalink
- Report Inappropriate Content
Anyone found a solution to this?
01-22-2024
09:34 AM
- Mark as New
- Bookmark
- Subscribe
- Mute
- Subscribe to RSS Feed
- Permalink
- Report Inappropriate Content
I'm also interested in this functionality. I haven't been able to figure out a way to achieve this. Any updates?