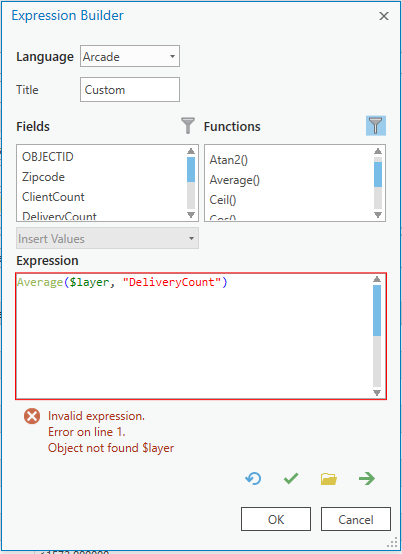
In https://community.esri.com/message/860558-mean-for-all-features-not-just-one-arcade I was able to figure out how to set up a pop up to display the mean() of all the features in a given feature layer. However, now I'm faced with the same requirement but for symbology.
As in the earlier post, I have the same polygon feature class of zipcodes, that represent monthly deliveries; for a given zipcode, there are twelve polygon features 'stacked' on top of each other, the result of monthly geoprocessing and appended to the zipcode polygon feature class.