Turn on suggestions
Auto-suggest helps you quickly narrow down your search results by suggesting possible matches as you type.
Cancel
- Home
- :
- All Communities
- :
- Products
- :
- ArcGIS Pro
- :
- ArcGIS Pro Questions
- :
- Line of sight profile graph have gaps
Options
- Subscribe to RSS Feed
- Mark Topic as New
- Mark Topic as Read
- Float this Topic for Current User
- Bookmark
- Subscribe
- Mute
- Printer Friendly Page
Line of sight profile graph have gaps
Subscribe
402
0
11-23-2021 11:06 PM
11-23-2021
11:06 PM
- Mark as New
- Bookmark
- Subscribe
- Mute
- Subscribe to RSS Feed
- Permalink
- Report Inappropriate Content
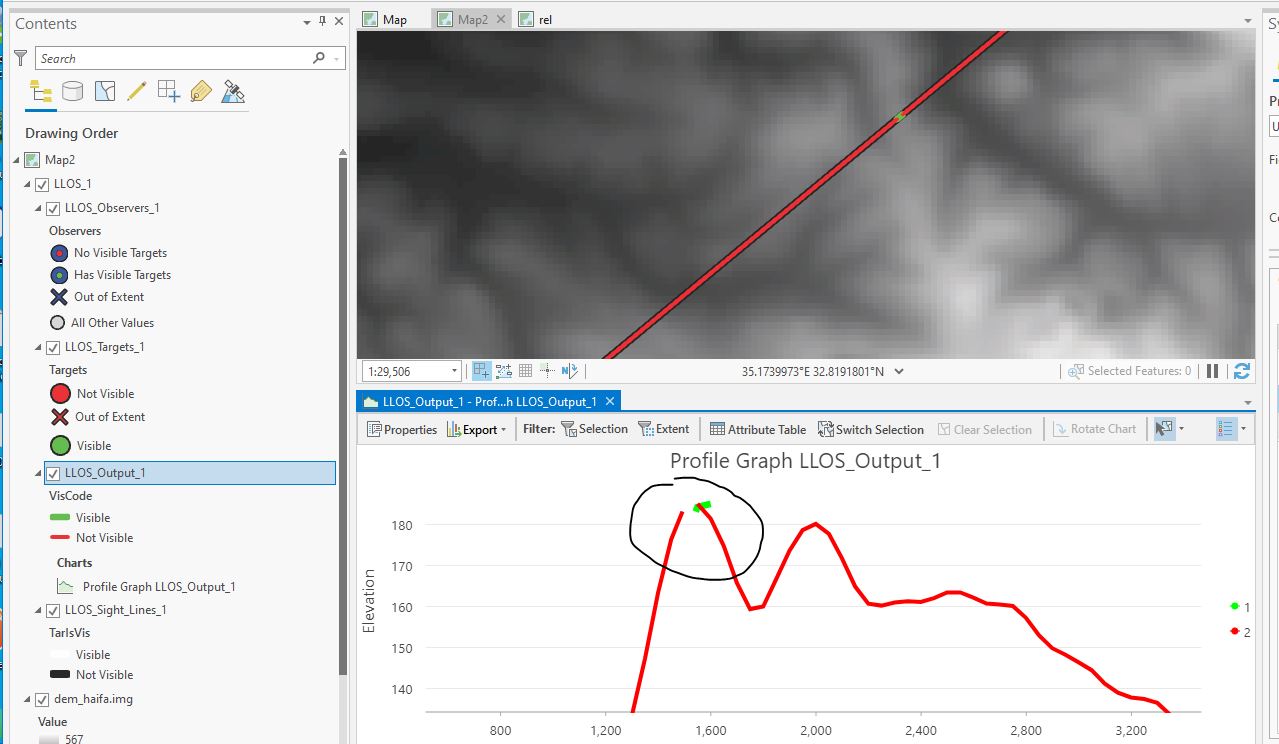
I am using Pro for visibility analysis to get a line of sight.
Then I create profile chart for the result LOS.
The profile shows the visible/invisible parts in red and green but the green and red lines are overlapped or unconnected - see screen shot.
I have tried it on a few dtm's and the problem exists in all of them.
Anybody doing this and get correct graph?
Thanks
0 Replies