Setting up the attribute-driven color in symbology in ArcGIS Pro 2.5

6679
14
02-26-2020 07:35 PM
by Anonymous User
Not applicable
15 14 6,679

I’ve been using ArcGIS Pro for several years now and strangely, I only recently learned about a quite cool capability of creating symbology based on colors that are stored as attributes (i.e. either as RGB values, HEX color codes or CMYK).

After spending an hour trawling through the Geonet Forums I saw a few threads where people were discussing this, however I was unable to find a defined process for setting this symbology up. The documentation doesn’t seem to contain it either, so I decided to quickly summarize the workflow in a quick blog post.

So, the situation that we’re going to be looking at is this:

A local council have their zoning polygons imported from MapInfo and they have three attribute fields (as below) – each storing a color (either Red, Green or Blue). Each zoning code must have a specific color used in the map to depict it, so we’re going to use these attributes to create symbology in ArcGIS Pro 2.5.

Step 1: Firstly, we need to create a new text (STRING) field:

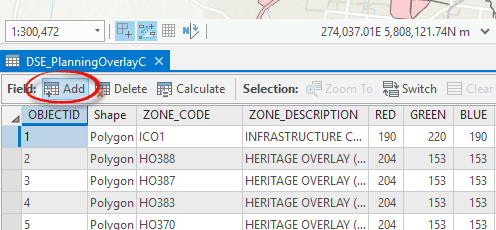
Add a field in the Fields Designer or use a geoprocessing tool Add Field.

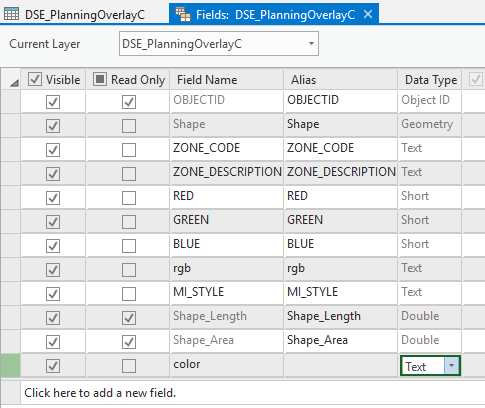
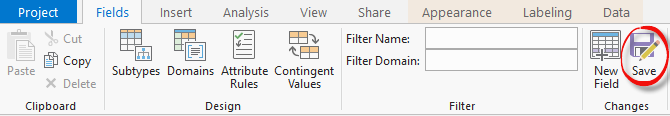
If you’re using the Field Designer in Pro, don’t forget to save your changes:

Step 2: Calculate the field values. In my example, I will be using Python. You can also create an expression using Arcade. Some examples are given in this Geonet thread: https://community.esri.com/thread/216350-set-symbol-color-from-rgb-values-in-attribute-table-with-ar...

In my case, I used the following expression: "rgb("+str(!RED!)+", "+str(!GREEN!)+", "+str(!BLUE!)+")"

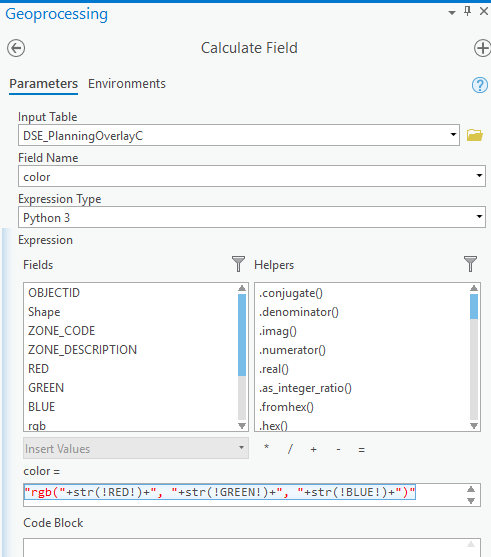
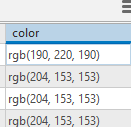
The output in the new color field should look like the following:

Other examples of how the color can be defined in that text field are given here: https://pro.arcgis.com/en/pro-app/help/mapping/layer-properties/attribute-driven-color-in-symbology....

Step 3: Now, the interesting stuff. Setup the attribute-driven symbology

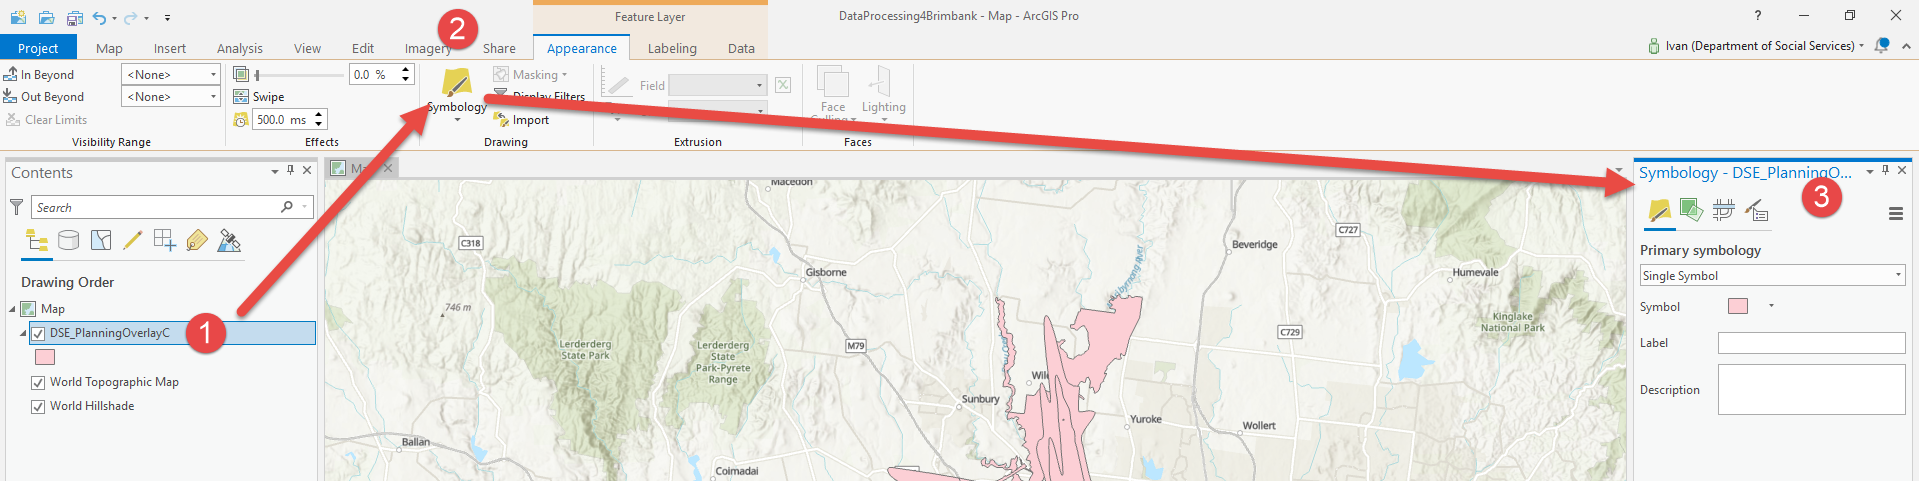
  • Highlight the layer under Contents (1 in the graphic that follows)
  • Click Symbology (2)
  • The Symbology Pane will open (3)

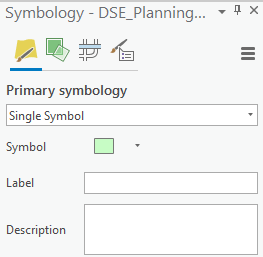
Enable the attribute-driven symbology (based on the combined RGB values). Unless you have a subtype field defined in the feature class, your starting point will be something similar to this:

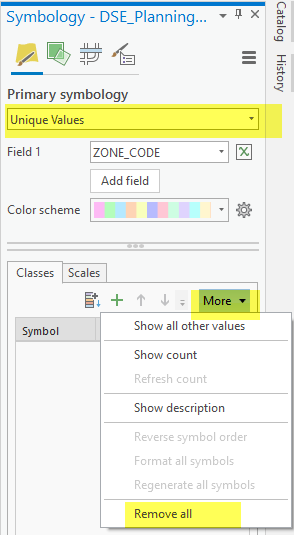
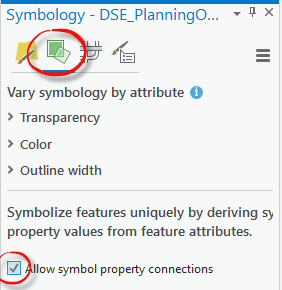
  • Symbolise with Unique Value, remove all of the symbols listed

  • Check the Allow symbol property connections option under the Vary symbology by attribute tab

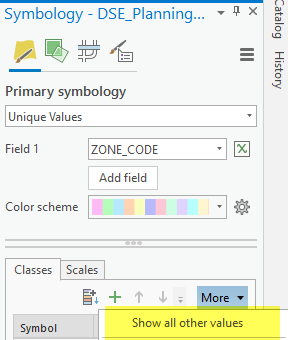
  • Return to the Primary Symbology tab, click the More drop down and select Show All Other Values.

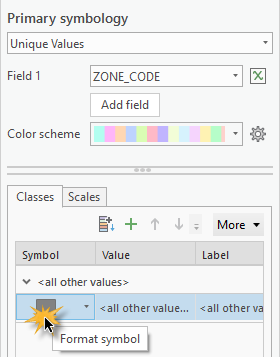
  • In the Classes section, right click on the <all other values> value and then select Format Symbol(s) (double-click on the colored rectangle)

  • Go to Properties (#1 on the screenshot below) > Layers (2), then select the fill symbol (3).  

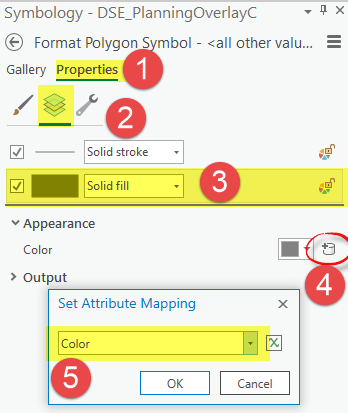
  • Under Appearance, select the database icon (4) to define the attribute to map, and select Color (5) or whatever you named that text field with the combined RGB colors.
  • Click ok then apply changes.

The layer in the Map will show the colors that will be read directly from the attribute table. However, there’s one problem. Even though the map will show the colors from the attribute table (stored as RGB, HEX or CMYK), the layer on the contents pain will still be showing <all other values>. You won’t be able to automatically create a legend or publish this straight to AGOL.

Our tech. support people investigated this, and this seems to be an issue that had been logged as the following bug: BUG-000104316: Attribute-driven symbology assigned to features is not reflected in the legend information for the feature layer

https://support.esri.com/en/bugs/nimbus/QlVHLTAwMDEwNDMxNg==
 

Hope it’s going to get addressed! In the meantime, hope the above is helpful. Please feel free to reach out if you have any questions or comments. Happy mapping!

14 Comments
XanderBakker
Esri Esteemed Contributor

Hi Ivan Ermoshkin ,

Great post and thanks for sharing. If I understand correctly from number 5 in your last screenshot, you don't need to create the text field, but you can directly create the Arcade expression to define the rgb to be used. Am I correct? 

by Anonymous User
Not applicable

Hi Xander Bakker

Thanks for this; I forgot to mention that. This is correct - you can use an arcade expression (i.e. "rgb("+$feature.RED+","+$feature.GREEN+","+$feature.BLUE+")" )in the Sett Attribute Mapping dialog. This will eliminate the necessity of creating a text field and concatenate RGB values. 

AnneSanta_Maria1
New Contributor III

Once you have set attribute mapping on one symbol in your unique values group, is there any way to have that custom attribute field appear in the drop down for all the other symbols?  For example, below, we have created a custom expression to vary color by the voltage level in the map. It then appears in the set attribute mapping box for that particular symbol. Is there anyway to have that custom symbol "field" carry across to other unique symbols without having to go through the trouble of opening the expression dialog box and importing that saved expression from a file? 

Xander Bakker

XanderBakker
Esri Esteemed Contributor

Hi santamaa ,

Can you provide a bit more detail about what you want to achieve? Do you want to apply this symbology to other layers? Are they of the same geometry type?

AnneSanta_Maria1
New Contributor III

Essentially, what we are looking for is a way to retain that arcade script within the same layer and have that custom field we created be available from the attribute mapping drop down, that is without actually adding a field. So this symbology could be applied to other layers of any geometry type, since this expression is varying color based on an existing field in the attribute table. You can import the arcade expression to re-use it, but it's a pain to click through the dialog boxes to do so.

For example in layer A, Electric Device, we symbolize by unique values using the field asset group.

Then we want to apply attribute mapping to each symbol using the same custom arcade expression by walking through the steps to set attribute mapping. We write a custom arcade expression for that unique symbol and apply the expression.

Next we want to apply that same expression to all the other unique symbols, but when we walk through the steps to set attribute mapping that custom arcade expression isn't in the drop down menu.

You basically have to import the saved expression over and over. It would be nice if the software would remeber the custom attribute mapping information and save it in the dropdown.

XanderBakker
Esri Esteemed Contributor

Hi Anne Santa Maria ,

I understand what you are looking for. Thanks for the additional explanation. However, at this moment, this is not possible. It would be great to have this option and reduce time defining the symbology.

There are a couple of things I notice based on your screenshots. You are using symbols provided in the Utility Network foundation, but you are symbolizing on Asset Group when we normally symbolize on Asset Type. You also have the field compatibleunits selected. Are you trying to symbolize the features based on CU's? Are you trying to incorporate this into the design editing to store the CU's of the assets you are editing?

AnneSanta_Maria1
New Contributor III

Thank you for your response. I had a hunch it wasn't possible, worth asking though. We've totally re-worked the utility network package, so this is just one way we are symbolizing items for the end user by asset group. The second screenshot related to compatible units was just a quick example, we aren't defining symbols based on this field currently.  

AdrianWelsh
MVP Honored Contributor

This is awesome and worked exactly as I wanted! However, when I went to publish the data from Pro to ArcGIS Online, the symbology in AGOL reverted back to just gray lines.... 😞

(I kind of expected that but it still made me sad since this was going to be a game changer!)

BranislavBlagojevic
Occasional Contributor II

With the introduction of bivarite colors symbology, the symbolization procedure described here is no longer applicable. Even after 4 years, ESRI did not solve the problem with the attribute-driven color in symbology, i.e. BUG-000104316 not fixed (!?!). But, during that time, regarding this, something still worked and that, of course, to the detriment of the users: the status of the bug from In current product plan changed to Not in Current Product Plan (!?!) https://support.esri.com/en/bugs/nimbus/QlVHLTAwMDEwNDMxNg== Commendable! And went a step further with "Additional Information: Duplicate of ENH-000135498: Better display of symbol preview or legend when conflicting visuals happens either through visual variables, scale based sizing, or attribute driven symbology ". I therefore ask the ESRI author who changed the status of the bug to explain what the ENH-000135498 has to do with the unresolved issue contained in BUG-000104316? What does the word "duplicate" mean in this context? How long do we have to wait to solve the problem of not reflecting the symbology assigned to features in the legend?

PavelBelsky
New Contributor

Hi there @Anonymous User.

Thank you for the detailed explanation of the process!

I have used the 'Vary Symbology By Attributes' option, and I have encountered an issue:

I have tried to randomly color the 3D trees symbology, and gladly succeeded to do that in GISPro (2.4)

but once I publish it to AGOL - it's reduced to only 2 colors:

attributes derived symbology.jpg

Is that something you can assist me with?

Thanks!!

MadelaineTaftFerguson
New Contributor II

I have the same question as @BranislavBlagojevic. What on earth? And is there any plan to ever make this translate to layers published to AGOL? Not particularly useful without that for our purposes.

JustinOdell
Occasional Contributor III

I love this feature within ArcGIS Pro, however when I publish a feature service from my ArcGIS Pro project, the attribute driven symbology is not preserved on the feature service. It is when publishing a map service, however.

TylerTownes
New Contributor III

@Anonymous User, I needed the attribute-driven-color for a project so I was thankful to find your article.  The process is not exactly intuitive, so thanks for the walk through.  I was a bit crushed when I got to the paragraph in your blog that the legend doesn't work.  I went ahead and tested it anyway and sure enough, the legend fails.  That's a show stopper.  

So my question is to you and others, are there any possible work-arounds to get the legend working?

Thank you,

Tyler

BranislavBlagojevic
Occasional Contributor II

The only way to create a legend is to use the Eyedropper function/tool. Use it to 'take' the colors of individual polygons and 'transfer' one by one to the legend i.e. 'Unique Values' symbolization panel. Good luck!