Dear all,
I have a set of boring data that I want to use to interpolate to find the hydraulic conductivity of the aquifer. Particularly, I want to look at the semi-impermeable layer that separates the 1st from the 2nd aquifer. I divided my 3D dataset in layers, so that I can work in 2D (which should be OK in a sedimentary aquifer). I have transformed my data into a binary set where 0=sand and 1=clay.
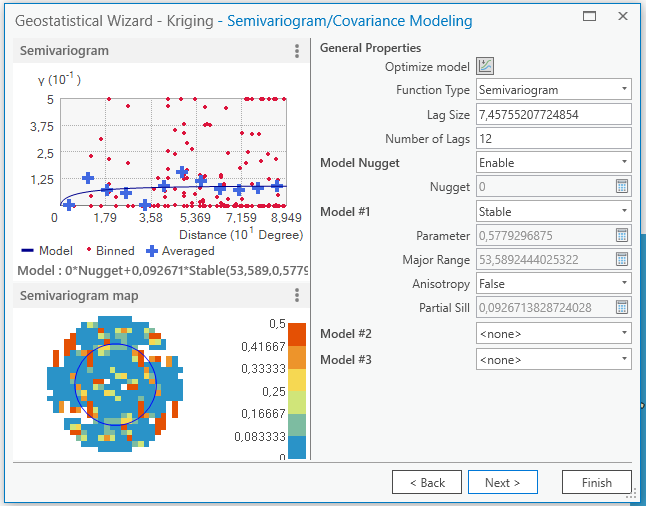
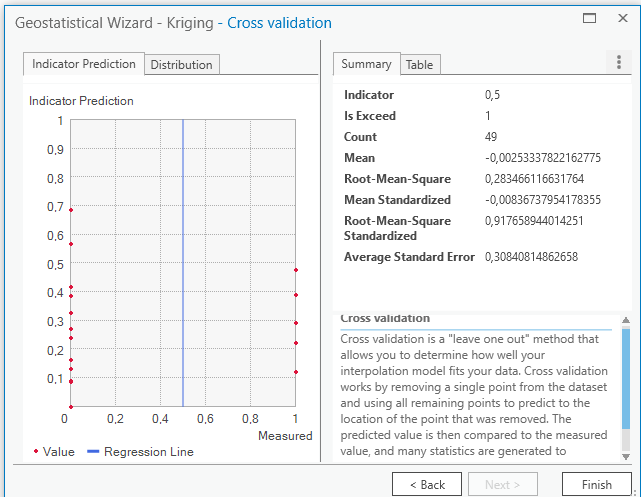
It seems to me this should be a relatively simple 2d indicator kriging exercise. I only find an esri course on EBK online, not on indicator kriging. Thus, I am not sure how to play with the parameters in the geostatistical wizard and I don't know how to interpret for example the semivaiogram and the indicator prediction for a binary dataset.
Does anyone have tips for documentation/tutorials on this? Or does anyone have tips for my work?
Thanks a lot,
Suzanne