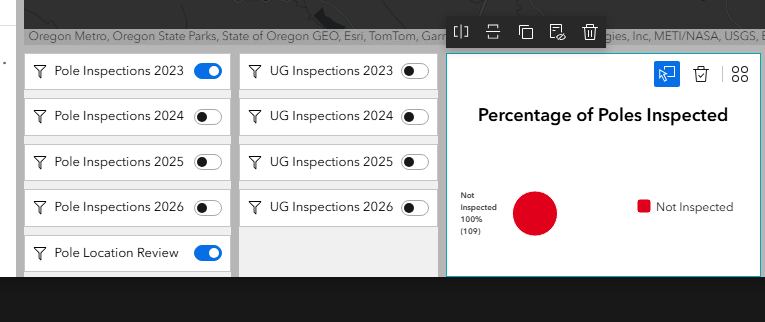
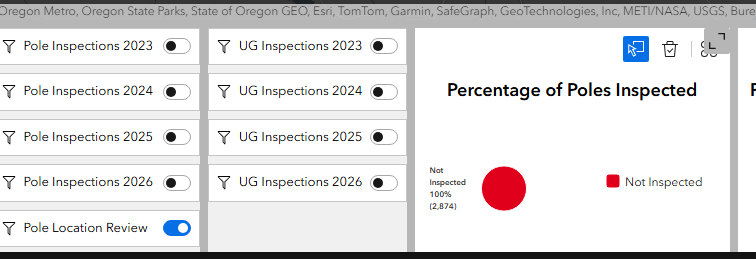
I'm building an EB dashboard to track power pole inspections. I currently have inspection year filters on the data. I'm trying to set up a dynamic chart to show the percentage of poles inspected each year. The problem I'm running into is that the filter only shows the total number of poles for that specific year. So on the chart I see the percentage of 109 poles inspected for 2023, but I want to see the percent of ALL poles inspected in just that year. I'm at a loss of how to set this up with the chart widget. In screenshot 1 below, it says that 100% of 109 poles were not inspected in 2023. In screenshot 2 the 2023 filter is turned off and you can see the percentage of total poles, 2874. So what I want to see is 109/2874 or roughly 4% for 2023. The client needs to inspect 10% of their poles each year, and keep track of that with this dashboard. Is this possible with the chart widget?