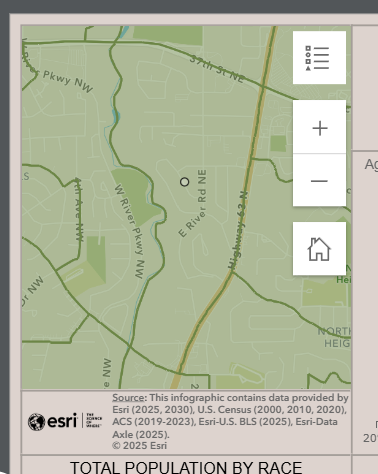
Hi! I'm wondering how do I change the color of the layer when I bring it into a map widget? I searched in all the properties in BA, I changed the Symbol field JSON for the layer in AGOL:
{"type":"esriSFS","color":[0,0,139,150],"outline":{"type":"esriSLS","color":[0,0,0,255],"width":1,"style":"esriSLSSolid"},"style":"esriSFSSolid"}I checked the visualization on the layer I want to pull in which is public. I created a public view for it where I set visualization. No matter what I do, I can't get it to stop being green. And only one color.
None of this impacts the color of the layer when bringing a layer into the Map widget.
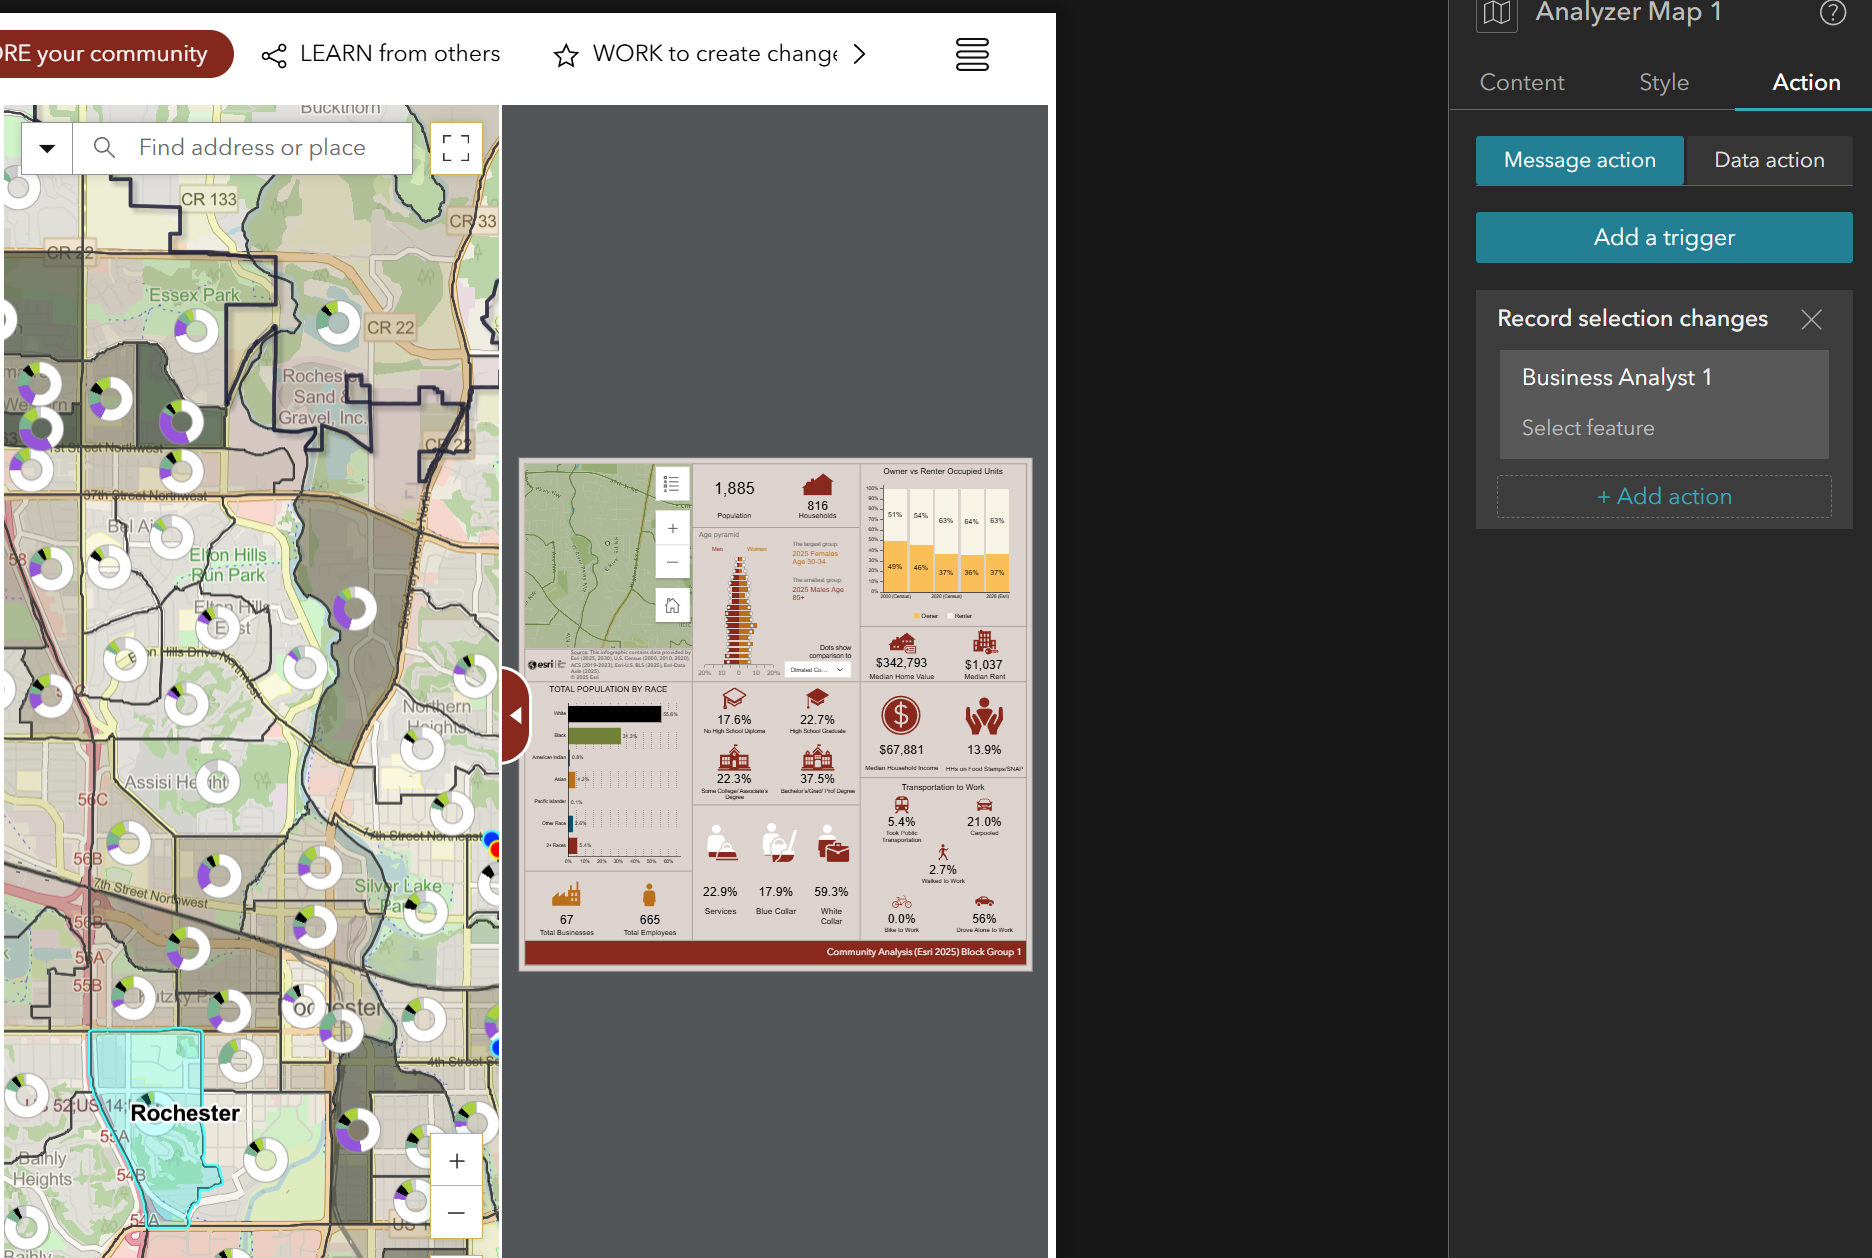
And really ultimately what I want is the selected area used for the infographic to be highlighted so it's really obvious that the infographic stats are based on that area - but there doesn't seem to be a way to add a trigger from a map click to transfer that to the BA widget (in ExB). Like it runs the infographic, but doesn't highlight the feature selected in the BA widget - it just pans and zooms.
Solved! Go to Solution.
I just realized that the layer in your web map is symbolized using a chart style which is causing this issue. This type of style and some others (Color and Size, Chart and Size, Types and Size...) are not yet supported in this specific scenario for infographics. In the meantime, I recommend the following workaround:
Save the web map and add it to your ExB app.
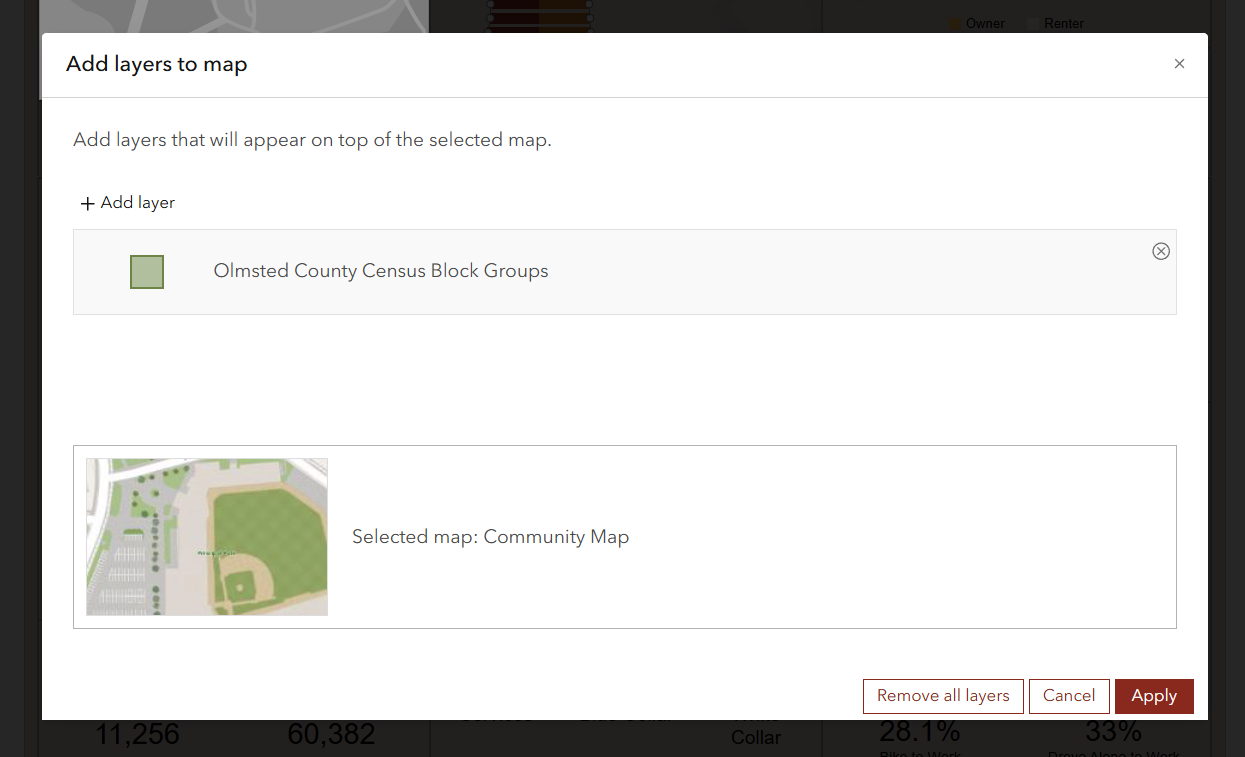
The BA widget in ExB is designed to respect the default style of the layer you select from the map. My recommendation is to simply not have the layer in the map element when building the infographics. Instead, remove the layer from the infographics here and save the template:
And when you run the infographics in the BA widget by selecting a feature on the map, that feature is automatically added to the infographics for you as follows:
Notice only the selected feature is included in the infographics. I hope this helps.
Fasil T.
BA Team
Thanks for the suggestion - unfortunately, when I remove the map layer in BA and then run the BA widget in ExB - now it shows no outline and just adds a point to the map vs selecting the map layer. It doesn't look like it adds it to the widget after selecting in the map.
I just realized that the layer in your web map is symbolized using a chart style which is causing this issue. This type of style and some others (Color and Size, Chart and Size, Types and Size...) are not yet supported in this specific scenario for infographics. In the meantime, I recommend the following workaround:
Save the web map and add it to your ExB app.
Oh Ok! Yeah - that was the issue I guess!
I added the block layer on top with no fill and now it's more like what I was expecting! Thanks!