I have an existing Dashboard with Construction data on it. I've encountered a lot of issues with this data specifically where the data would just go corrupt suddenly and the dashboard would be unavailable. I've had to re-build this dashboard multiple times over the years, and recently, I just re-created the data from scratch to see if it would resolve the reoccurring issues.
Now that everything is resolved (yay!)... long story short, I don't want to modify anything unnecessarily, especially if it sends my data into a tailspin again. So here is my question.
The intention of this dashboard is to see where our money is spent on Construction. The data is formatted by Funding Source, as you can see below. Many projects span multiple municipalities, so I have one field that just lists them out so they can be displayed on the pop-up.
Recently, an Administrator asked if we could display this data (in another dashboard) by Municipality. So think of bar charts rather than the $$ boxes. However, the data is not set up to display this currently, since the Municipal field I have just lists them out.
What is the easiest way to go about this? Like I said, I don't want to unnecessarily edit the data unless I have to. In the past, someone helped me add a Related Table and I took each construction project's GUID and entered it into the Related Table and typed the municipality there. But that was an older dataset, and I didn't think we needed it this time around.
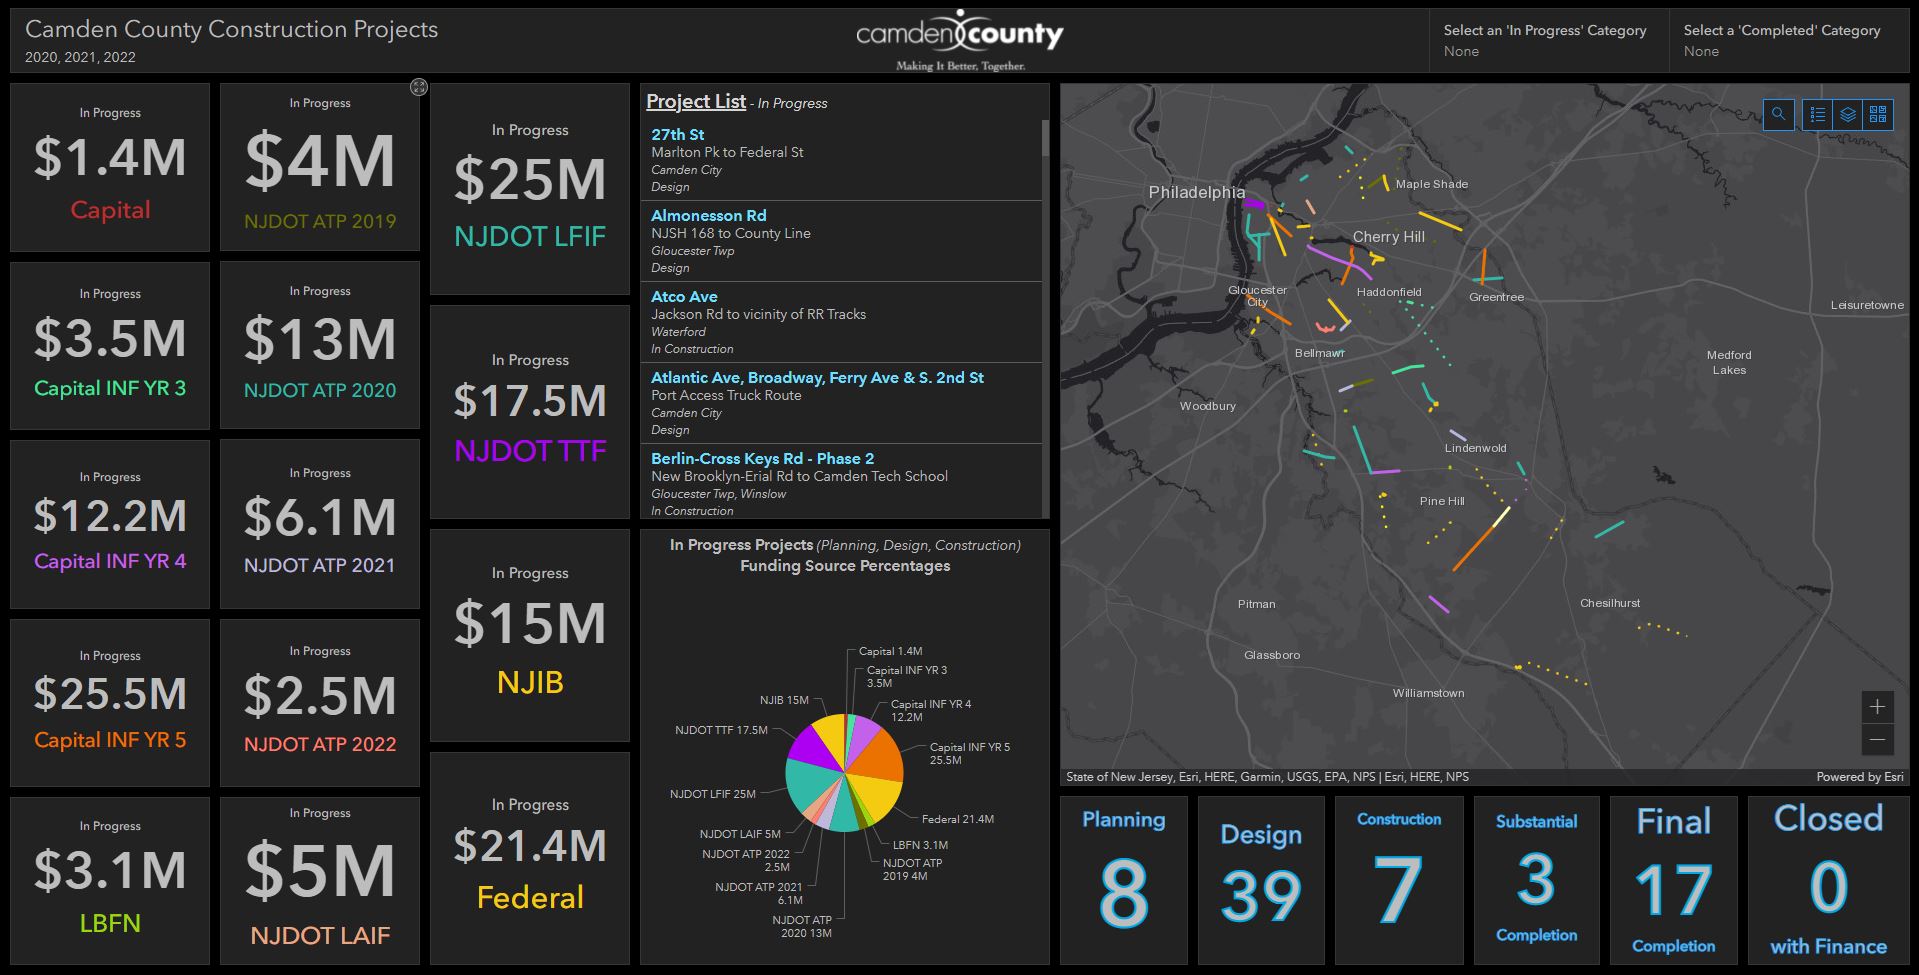
If you're still reading, thanks for sticking around. I could really use the help on this one. The GUID/Related Table concept is really confusing for me. If there's an easier way, I'll take it!