What is a Stream Service?
In addition to the well-known and long-existing Map & Feature Services, there has been a new service type in the ArcGIS world for a few years now (first release with 10.3), which was primarily developed for efficient visualization of real-time data - the Stream Service.
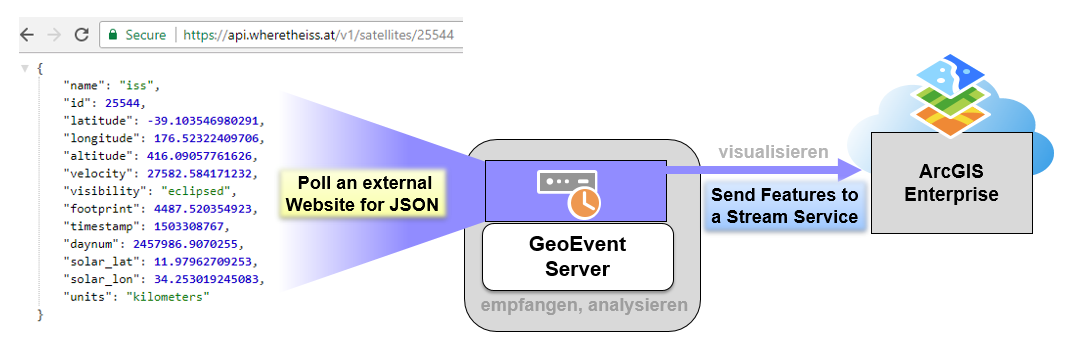
The Stream Service is linked to the ArcGIS GeoEvent Server, Esri's software solution to integrate real-time data streams, perform event-based analyses on incoming data in real time, and then distribute it, i.e., make it usable within and outside the ArcGIS platform. Naturally, the requirement to not only process but also visualize data in real time plays an important role. Due to this requirement, the development team around the GeoEvent Server considered how to reduce latency in visualizing dynamic data to not only show WHERE something happens but also directly WHEN it happens!
An example of a Stream Service that queries and visualizes the current position of the International Space Station from an API can be viewed here .
A new concept for visualizing dynamic data!
Traditionally, the data underlying a dynamic Feature Service is stored in an Enterprise Geodatabase (EGDB) or other forms of data storage such as the Spatiotemporal Big Data Store (SBDS*). This means that when visualizing, the client, e.g., our web application, must regularly query the current status from the data store at intervals to update the visualization of features on the map. This process is called polling, which corresponds to an update interval that causes a delay in processing real-time data streams after the GeoEvent Server has processed them and written them into the database.
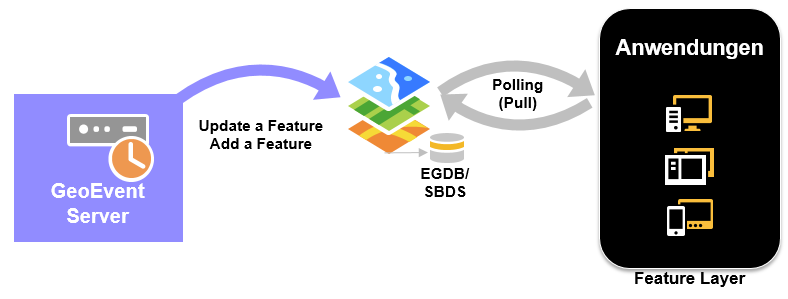
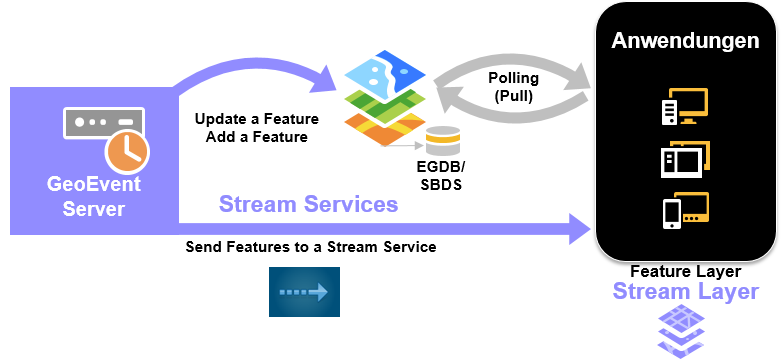
To minimize this latency, the Stream Server is based on a concept where data is not first written into a database but pushed directly to the client. For this purpose, WebSocket connections are established directly between the Stream Server and the Stream Layer in the client, over which features are transmitted and visualized without any delay!
Persisting Data
Perhaps now the question arises what happens if a client initially connects to the Stream Server and existing data has not been saved? This would mean that the client can only visualize existing features when a new event, i.e., status update for this feature, has been processed by the GeoEvent Server and forwarded to the Stream Server. This is naturally not an ideal scenario, especially if not all features are updated at short regular intervals and thus might not appear in the application for a longer period.
Therefore, there is a concept for Stream Servers called "Store Latest" Feature Service, which can be published alongside the Stream Service and where, as the name suggests, the latest states of respective features are stored in parallel. If this option is selected, information about the "Store Latest" Feature Service is stored in the description of the Stream Service. Thus clients can perform a query for current states of features from this Feature Service upon initial connection with the Stream Server and visualize them on the map simultaneously. Afterwards, the Stream Layer takes over again and visualizes new events immediately in real time!
Joining Geometries and Static Attributes in the Client
Of course, ideally only dynamic information of a feature should be constantly updated—for example, static sensors in a sensor network usually have continuously updating measurements while information such as geometry or other sensor properties are mostly static. Therefore, a concept was integrated into the Stream Server for these use cases that allows referencing a Feature Service with "Related Features." With this information, which is also provided to clients via the Stream Server description, static information can be added directly in the client to incoming events via a unique ID (Track ID).
Opportunities for Developers
Stream Server or rather the Stream Layer in applications also offers interesting opportunities for developers to further utilize this technology. Since its original release in version 10.3, the Stream Layer has been usable in JavaScript-based web applications via the ArcGIS API for JavaScript and is continuously integrated into other ArcGIS components and APIs. An interesting possibility here is to subscribe to "onMessage" (JS API) / "on_features" (Python API) events of the Stream Layer, which allows analyzing every event sent in Esri JSON format before it is visualized on the map.
In the already mentioned ISS Demo, I use for example the "onMessage" event of a StreamService which sends along a GeoTag indicating whether ISS is flying over land or ocean to update text display upon "land change."
Have fun exploring and using this new layer type in your real-time applications!
Tom
*PS: More details about Spatiotemporal Big Data Store will be provided in one of the next blog posts!