I'm busy summarizing the landuse found within each of my watersheds using Zonal Histogram. I'd like to pivot the Hydro (i.e. Hydro_1236 etc.) columns to rows and pivot the Label Column values to column headings. I've attached the Zonal Histogram Results Table as well as a mock-up of the table structure that I'm looking for.
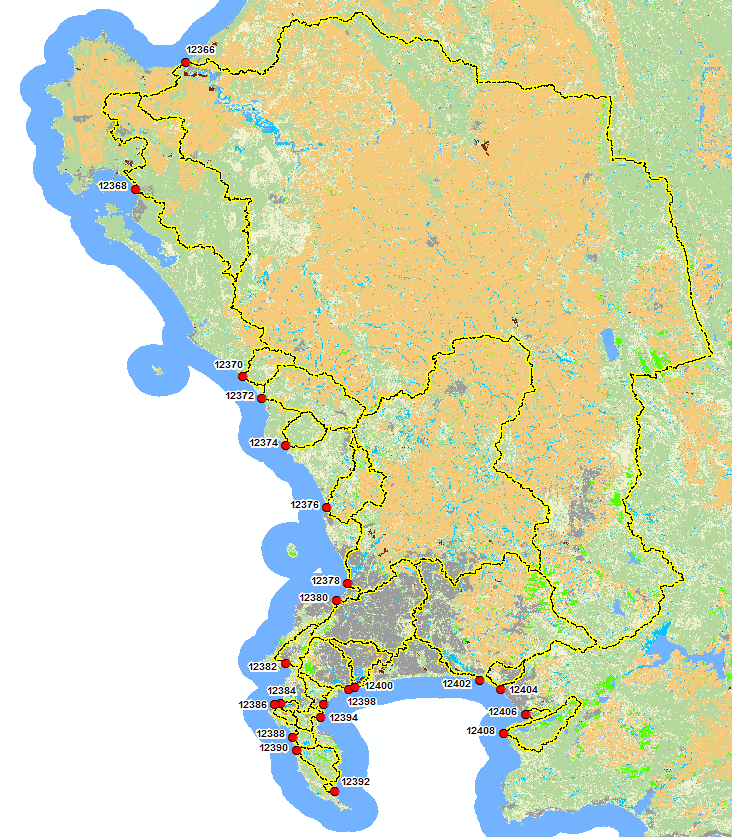
Watersheds + Land-use Raster

Zonal Histogram Results Table
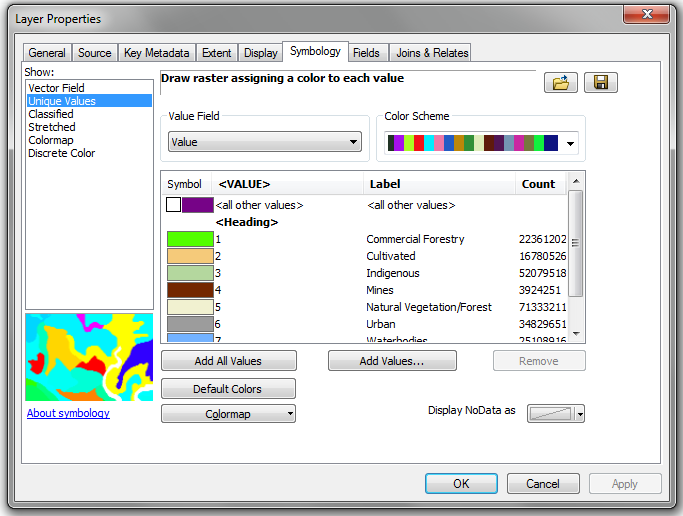
Landuse Raster: Classification
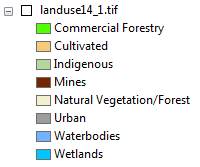
Landuse Raster: Labels
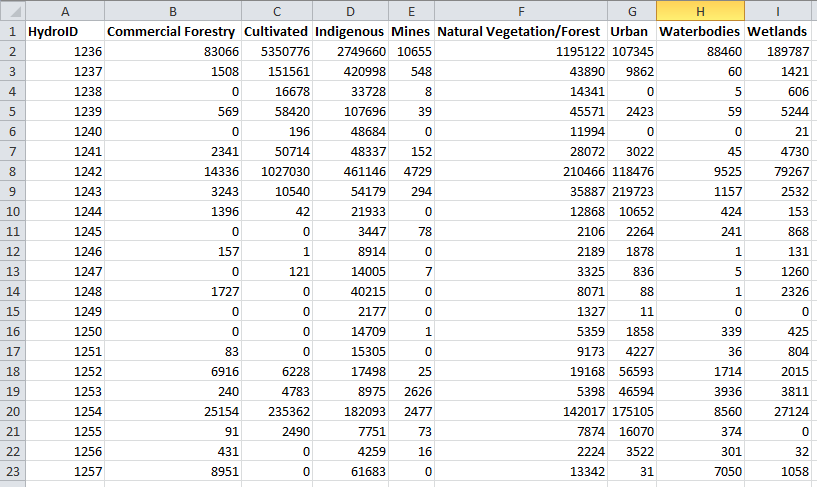
Pivot Results Table:
Note that the HydroID field values were based on the following fields: Hydro_1236 etc. I removed "Hydro_" before adding them to the HydroID field.
How can I achieve the following using either Python Pivot Table or Pandas, thanks in advance for any help on the following.


