ArcGIS Pro 2.5
This is new territory for me; I haven't created surfaces since ArcInfo 6.x with TINs....
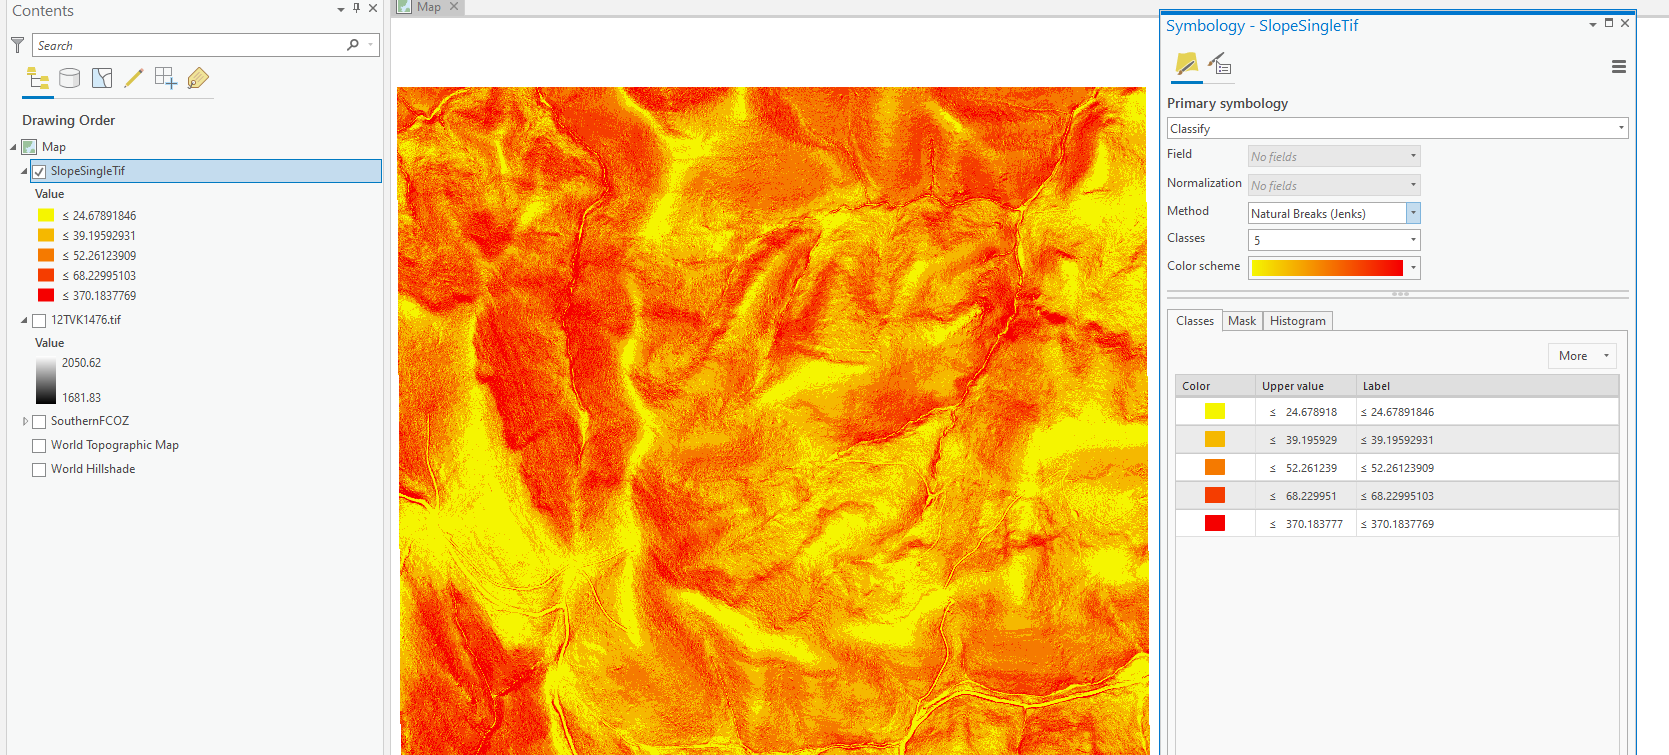
I have a number of tif rasters that I am attempting to create a slope analysis from. I think I've created what I want, but I don't understand how to display it in a map. Basically I want to show slopes less than 25% in green, 25%-35% in yellow and anything greater than 35% in red. See screen capture below.
I took a look at https://community.esri.com/message/895485-re-slope-percent-symbology?commentID=895485#comment-895485 but it applies to ArcMap, and I don't see a clear correlation to ArcGIS Pro.
The original tif raster has elevation in meters, hence the range of 1681-2050. Using the Spatial Analyst tool box, I just used the Slope geoprocessing tool; entered my input raster, output raster, setting my output measurement to Percent Rise. So far so good.
Choosing Classify as the 'Primary symbology' scheme, I can only set the number of breaks; what are the units it is displaying? How do I display my slope raster described above?